
Marketer, analyst, ex-CMO focused on the Google ecosystem (Ads, Merchant Center, GA4, GTM). Google Partner. 150+ projects, 100+ positive reviews on Freelancehunt, 12+ countries.
- I work directly, with no account managers or subcontractors
- I measure results in sales, not in-platform conversions
- Maximum expertise in the Google ecosystem — instead of “PPC, social ads and SEO, all in one”
Ad decisions are made based on analysis: raise the budget, turn off a campaign, change contractors. If the analysis is flawed, the decision is flawed too, even when the ads themselves are set up fine. Below are the mistakes I see most often in audits, in the order I come across them.
Contents
Analyzing ads only in the Google Ads account
The most common one. The account shows conversions by click date, doesn’t know about canceled orders, and doesn’t see sales by phone, via messengers or email without a Google Click ID. As a result, the numbers in the account can be either worse or better than reality.
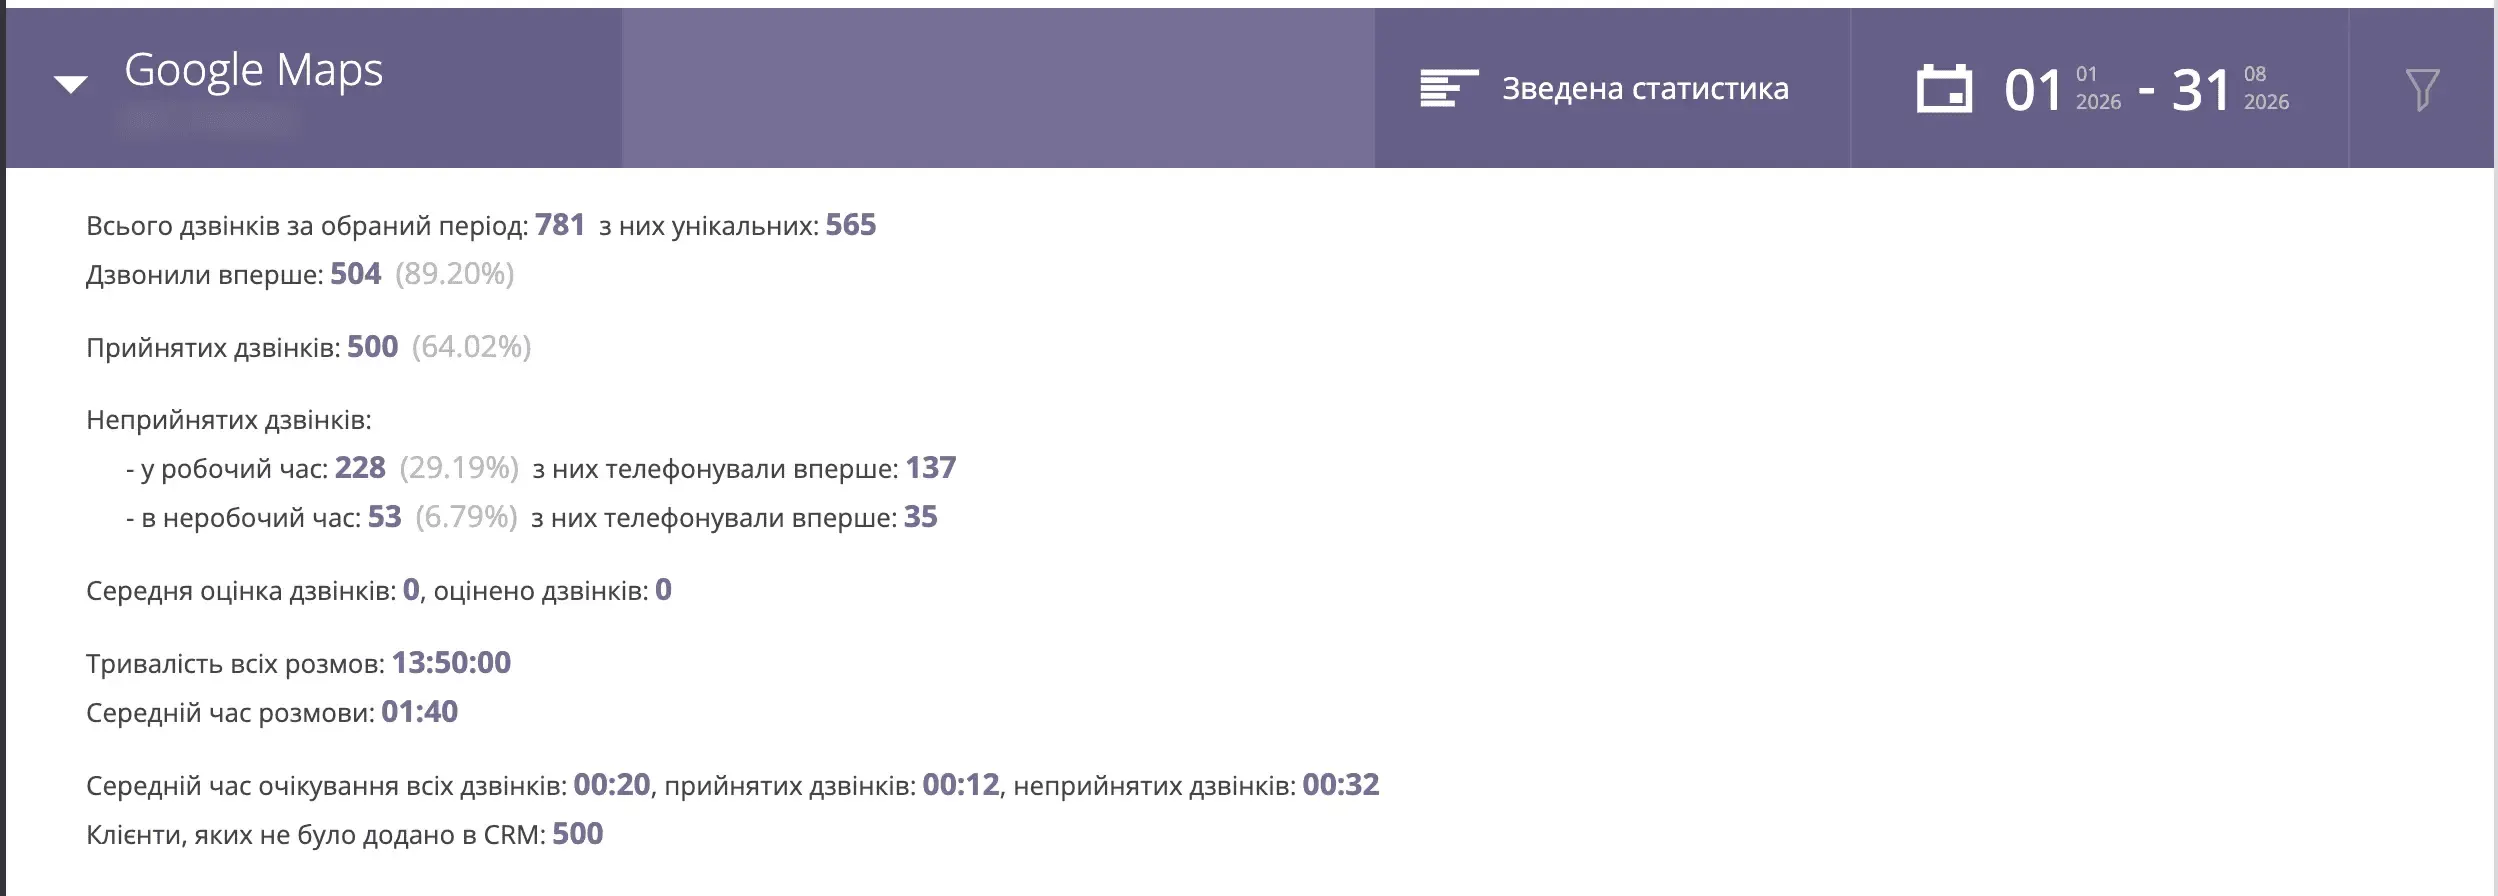
For a chain of steel warehouses the account showed 586 leads at 623 UAH. After I closed the attribution gaps — the cart, goals, messengers, calls from Google Maps — the real picture became 1,196 leads at 244 UAH. The cost per lead turned out 2.3 times lower than the client thought.
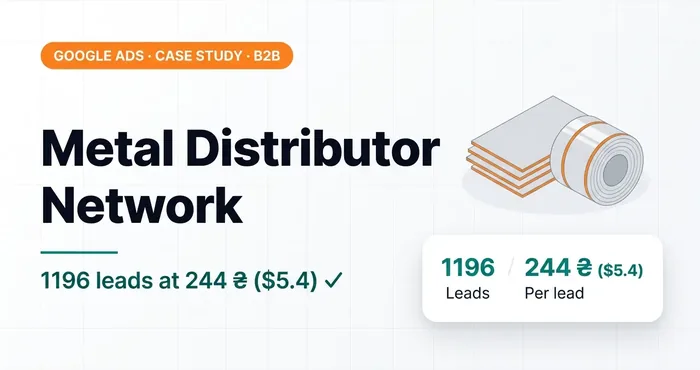 Google Ads case study · B2BGoogle Ads case study: steel distributor where the real cost per lead turned out 2.3x lower than in the accountSteel stockyard network: four attribution gaps — cart, goals, messengers, Maps calls. 1,196 leads at 244 UAH ($5.4) instead of 586 at 623 UAH ($14).
It happens the other way around too. A tea store with a budget of about 200,000 UAH a month saw a ROAS of 6.95 in its reports, yet the money in the business didn’t add up.
Still Judging Performance Only in Google Ads? That’s Why Things Are So Bad

Trusting conversions without checking what they count
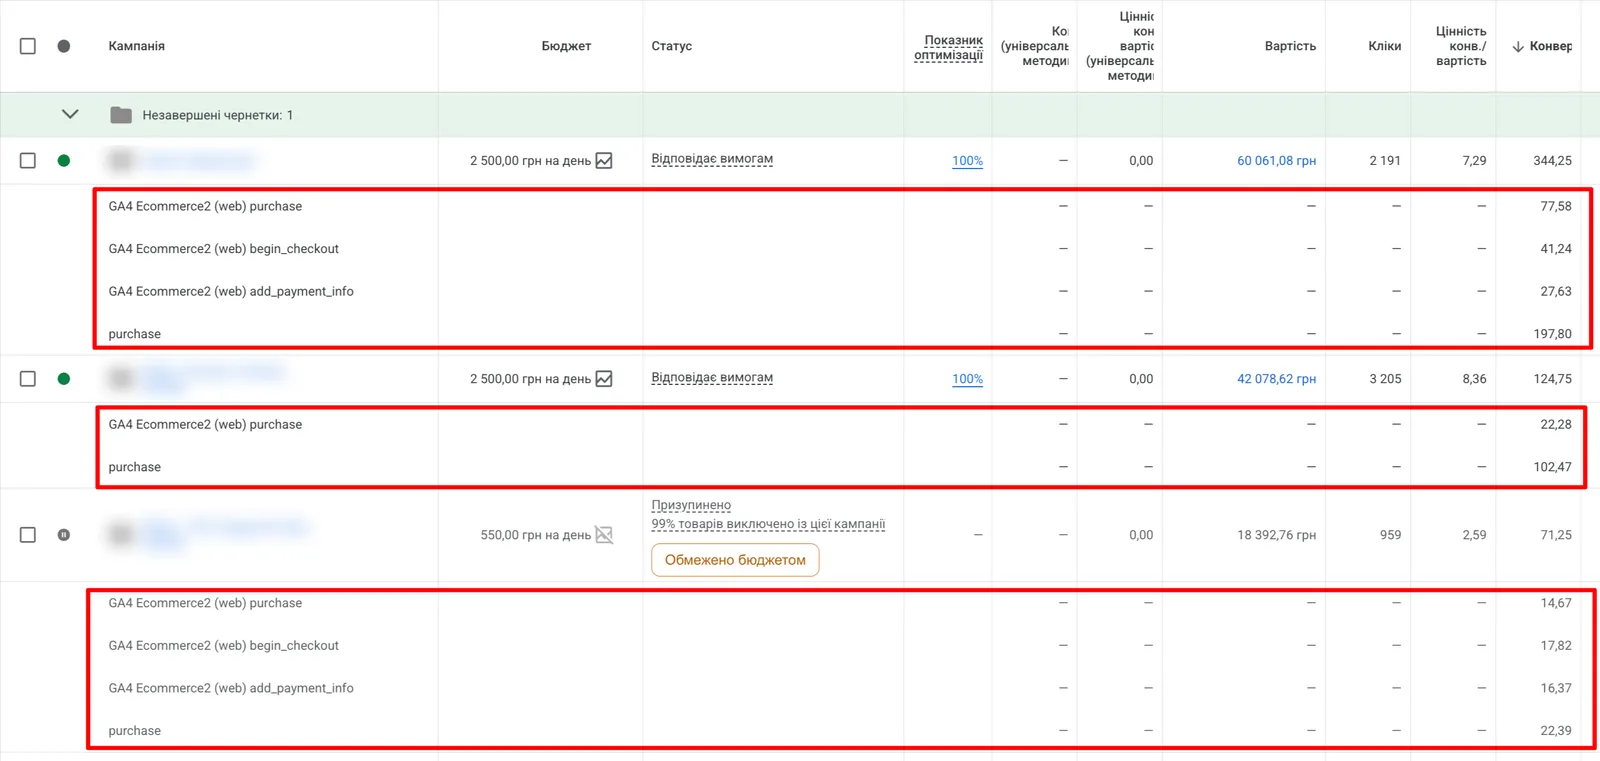
About 95% of the projects that come to me for an audit have tracking problems. Conversions are duplicated, repeat calls and messenger button clicks are counted, events fire on the wrong actions. In a private clinic the “call” goal counted everything: a person couldn’t get through and dialed again — two conversions; called to reschedule — one more. Analyzing cost per lead on data like that makes no sense.
So before any analysis I check what exactly is recorded as a conversion and whether the number of conversions matches the number of real leads or orders.
Google Ads | What a Disaster Looks Like in 2026

Drawing conclusions by day and week
“Yesterday there was one lead, the day before five — what happened?” Nothing. In a dental equipment store over seven months, daily ROAS jumped from 0.16 to 83, a 524x spread. By week — 3.1x. Between months — about 30%. And that’s a project with over 400 orders a month. If you have 30, you need years of data for sound conclusions.
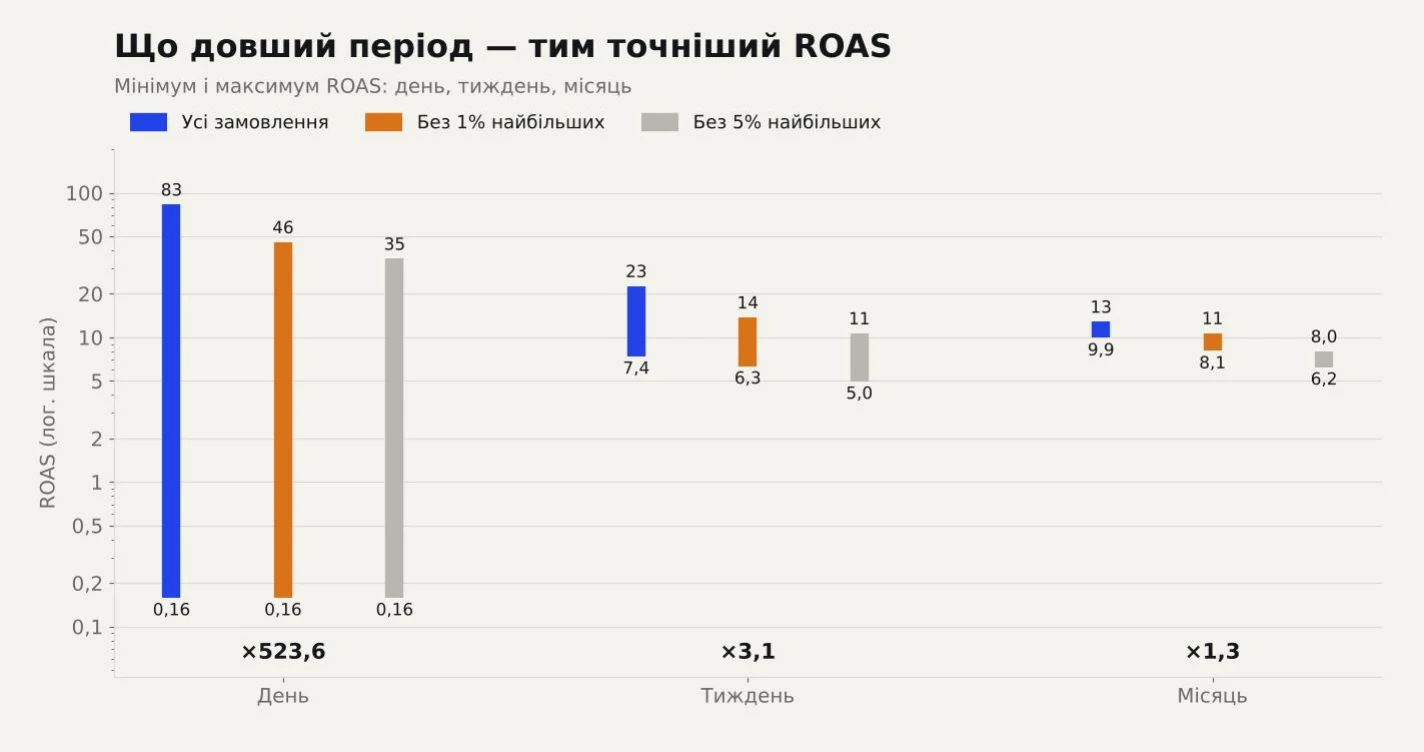
In the same project, 37 days out of 214 ran at a loss, but not a single week did. The only failed week came from one order entered incorrectly in the CRM.
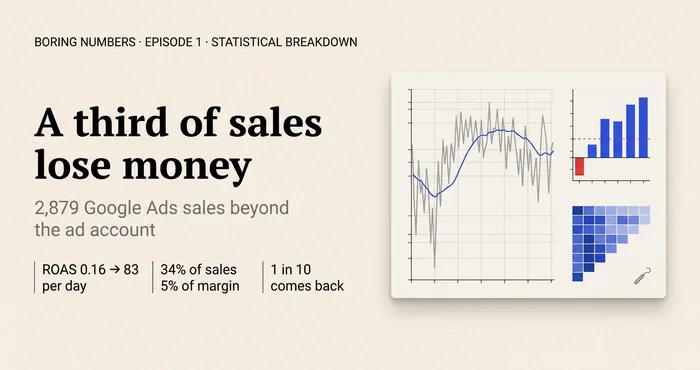 Analytics · Google AdsGoogle Ads Analytics Beyond the Ad Account: A Statistical Breakdown of 2,879 Dental Equipment SalesA statistical breakdown of 7 months of Google Ads for a dental equipment store: ROAS noise, big deals, loss-making cheap baskets, calls and LTV.
Looking at ROAS without margin
ROAS shows revenue per hryvnia of ad spend, not profit. Three campaigns with almost the same ROAS can give a ROMI that differs twofold because they sell products with different margins. Even simpler in numbers: spend 21,000 UAH, revenue 150,000 UAH, ROAS 714%. Sounds great. But at a 15% margin, 1,500 UAH is left after ads.
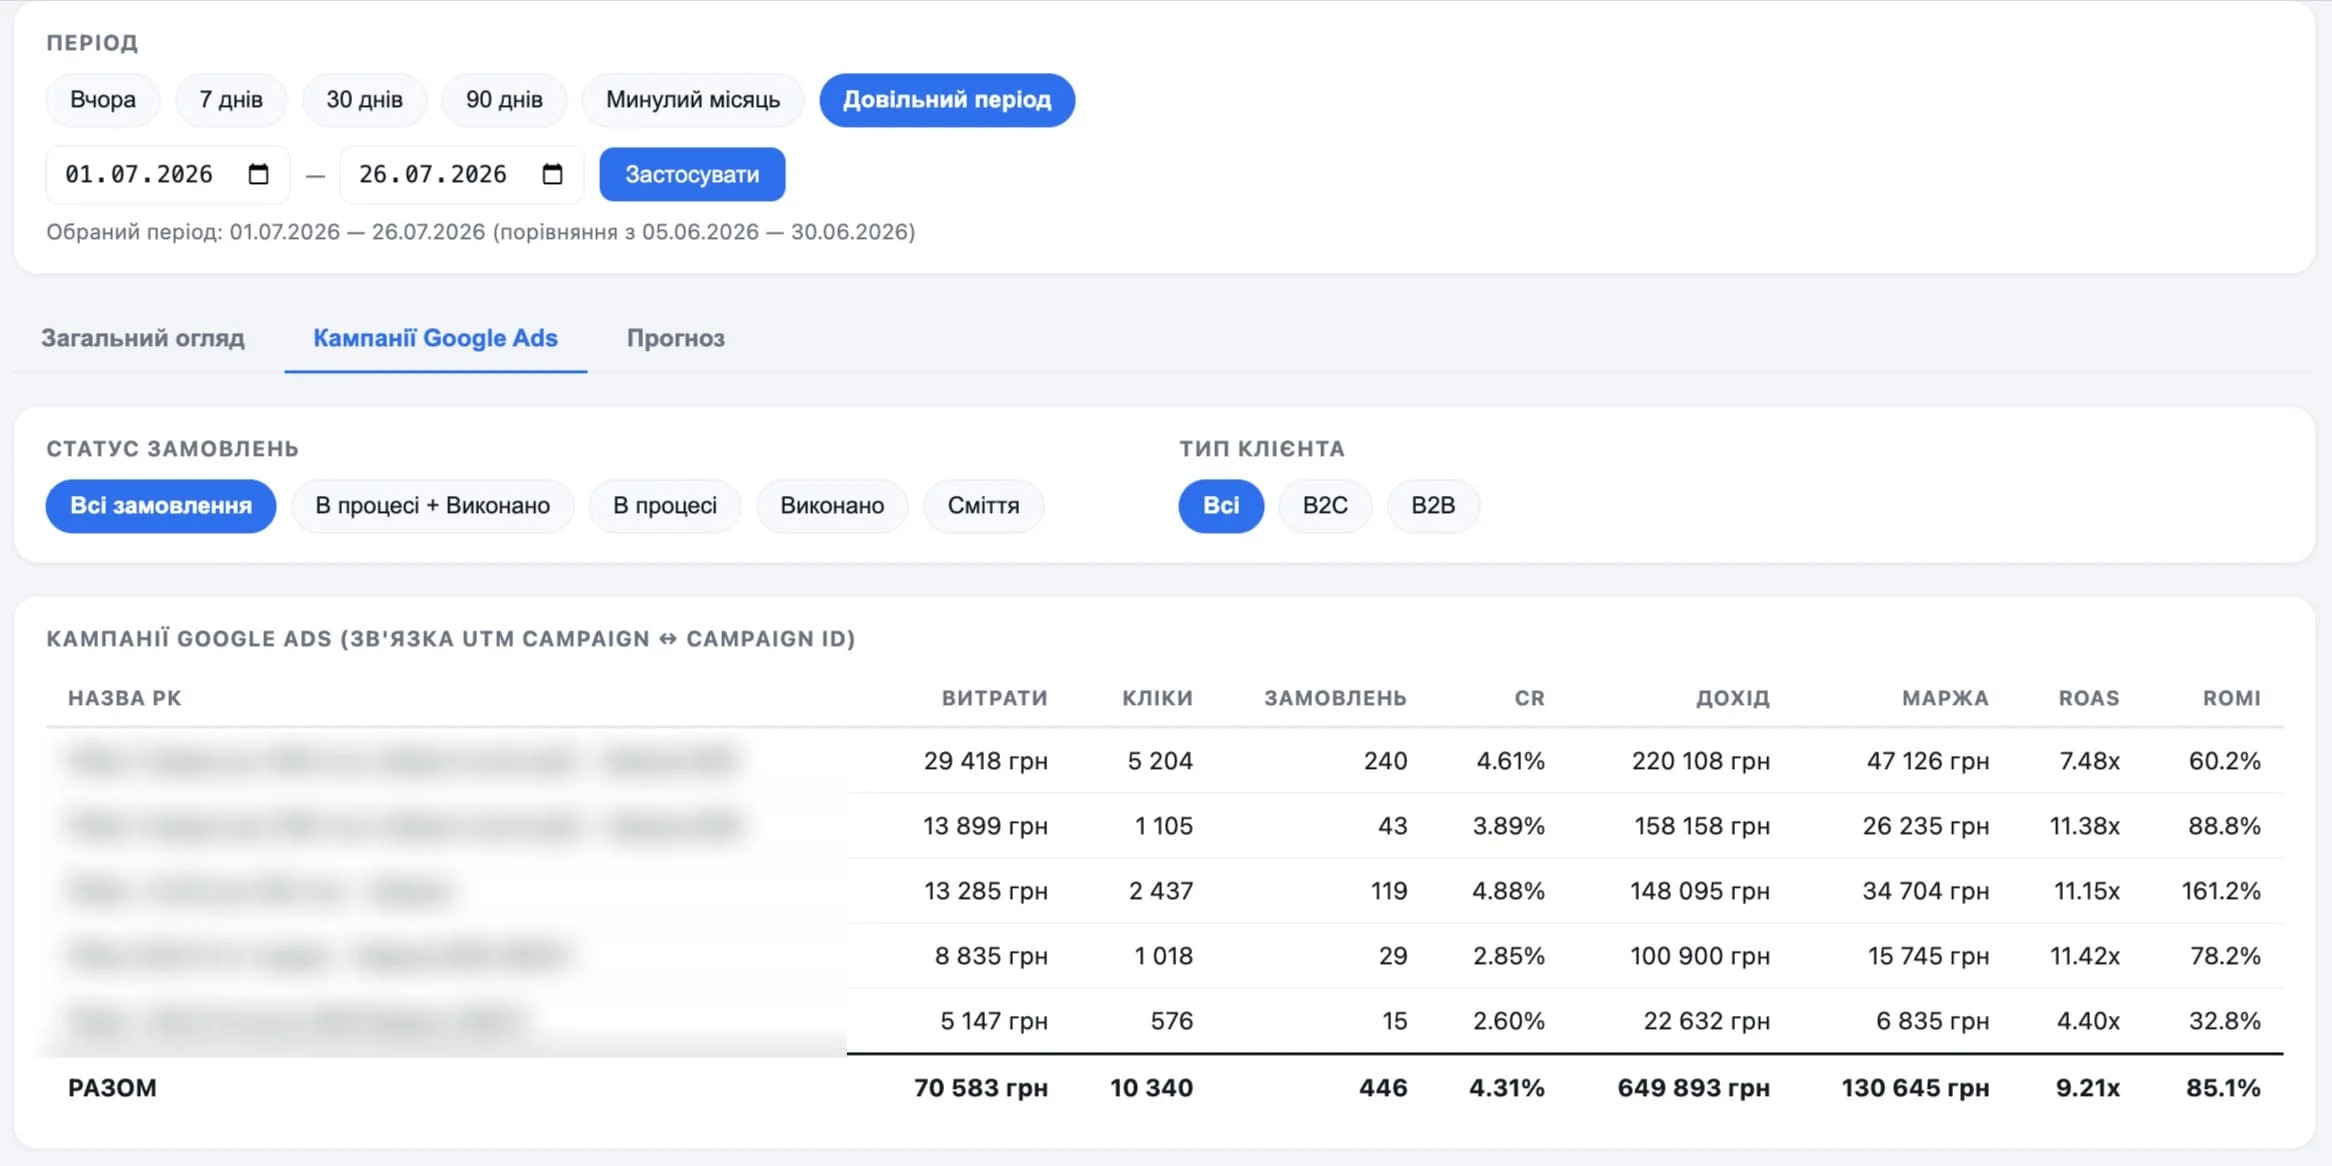
If only revenue is passed to Google Ads, the algorithm chases expensive products even if they’re low-margin. More in the article on the difference between ROAS and ROMI.
Mixing what should be analyzed separately
Brand and non-brand. Brand queries are always cheaper and convert better, because the person is already looking for you. If they run together with generic queries, the average cost per lead looks decent, while the real cost of a new customer can be several times higher.
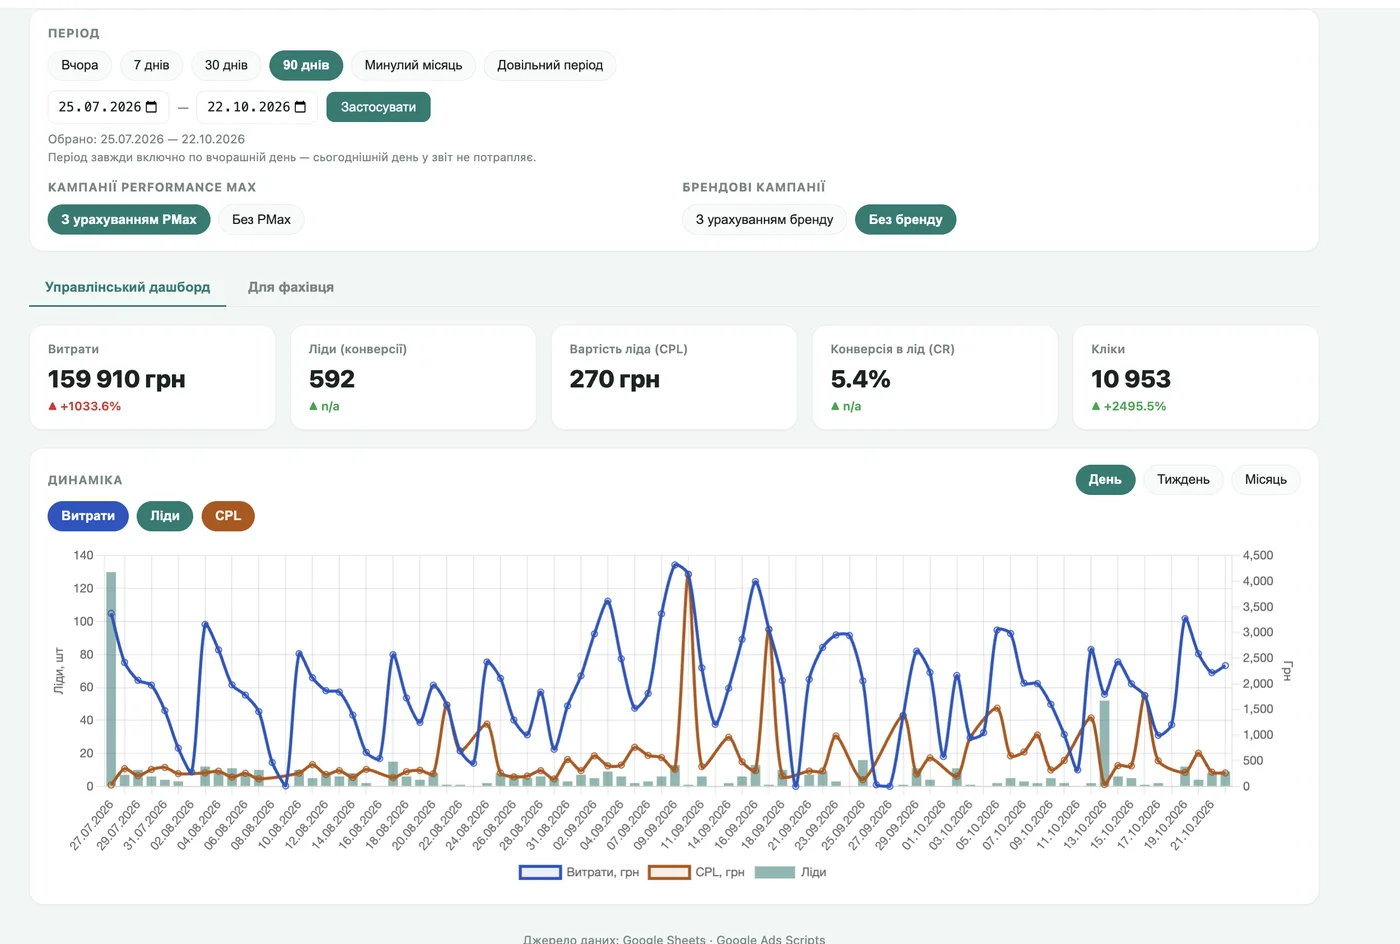
Performance Max and Search. In a clinic I work with, the click-to-lead conversion rate with Performance Max is 5.4%, without it — 10.9%. Performance Max brings a lot of cheap placement traffic, and in the overall number it blurs everything. That’s why in client dashboards I add separate toggles for Performance Max and for brand.
Looking for the cause only in the ads
A plant nursery store came for an audit with a question: the budget grew by 87%, yet orders went down. The cause turned out to be not the ads but the minimum order amount on the website.
In a clinic, ads brought qualified calls, but the front desk didn’t mark missed ones, and Google Ads saw 2–2.4 times fewer leads than there really were. For three months I looked for the problem in the campaigns, and it was at the reception desk.
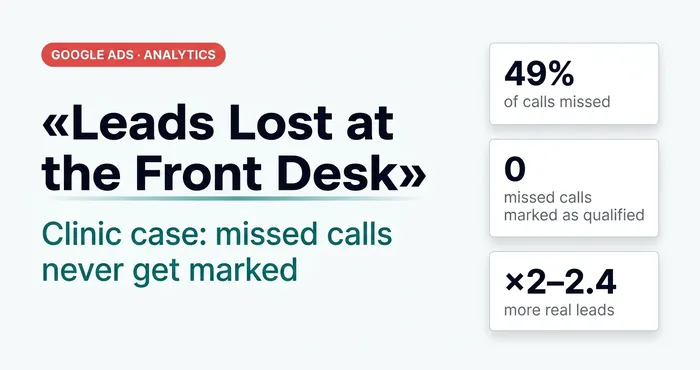 Analytics · Google AdsThree Months Treating the Ads. The Front Desk Was SickA clinic marks qualified calls in Binotel, but never the missed ones. Why Google Ads sees only half the leads — and why the problem isn’t the ads.
Price, website, lead handling, product availability — all of this affects ad results, but none of it is visible in the account.
Judging ads by clicks and CTR
Clicks, impressions, CTR are working metrics for a specialist. They tell a business owner nothing about money. A high CTR doesn’t mean sales, and a ten-page report of click charts doesn’t answer how much you earned. I explained why CTR isn’t a KPI in the article does CTR affect business metrics.
Check your report
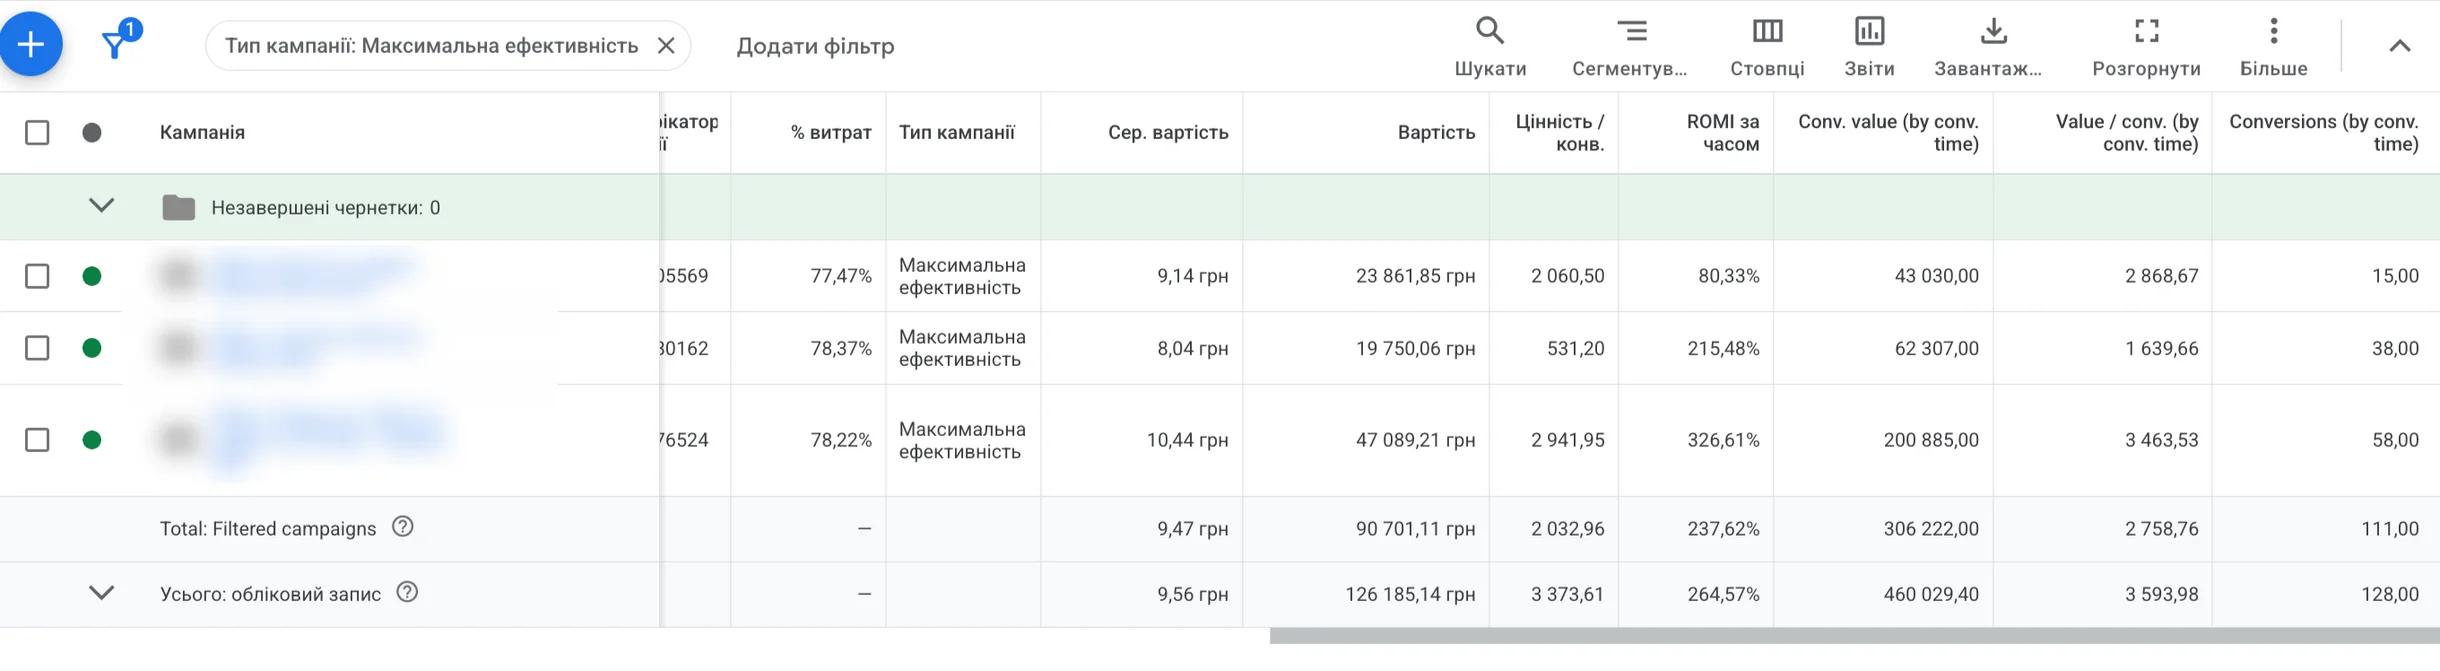
Take your latest monthly ad report and look at three things. Where do the numbers come from: the account or the CRM? Are brand and Performance Max shown separately? Is profit calculated with margin, not just revenue? If the answer to all three is “no”, the decisions you make based on this report rest on incomplete data.
03 — AuditGoogle Ads account auditI find where the budget leaks: structure, bidding, keywords, conversion tracking, website.
Where to find me
Message me on Telegram or by email — I respond quickly. Telegram channel and YouTube are for those who want to see real cases before reaching out and understand my approach.