
Marketer, analyst, ex-CMO focused on the Google ecosystem (Ads, Merchant Center, GA4, GTM). Google Partner. 150+ projects, 100+ positive reviews on Freelancehunt, 12+ countries.
- I work directly, with no account managers or subcontractors
- I measure results in sales, not in-platform conversions
- Maximum expertise in the Google ecosystem — instead of “PPC, social ads and SEO, all in one”
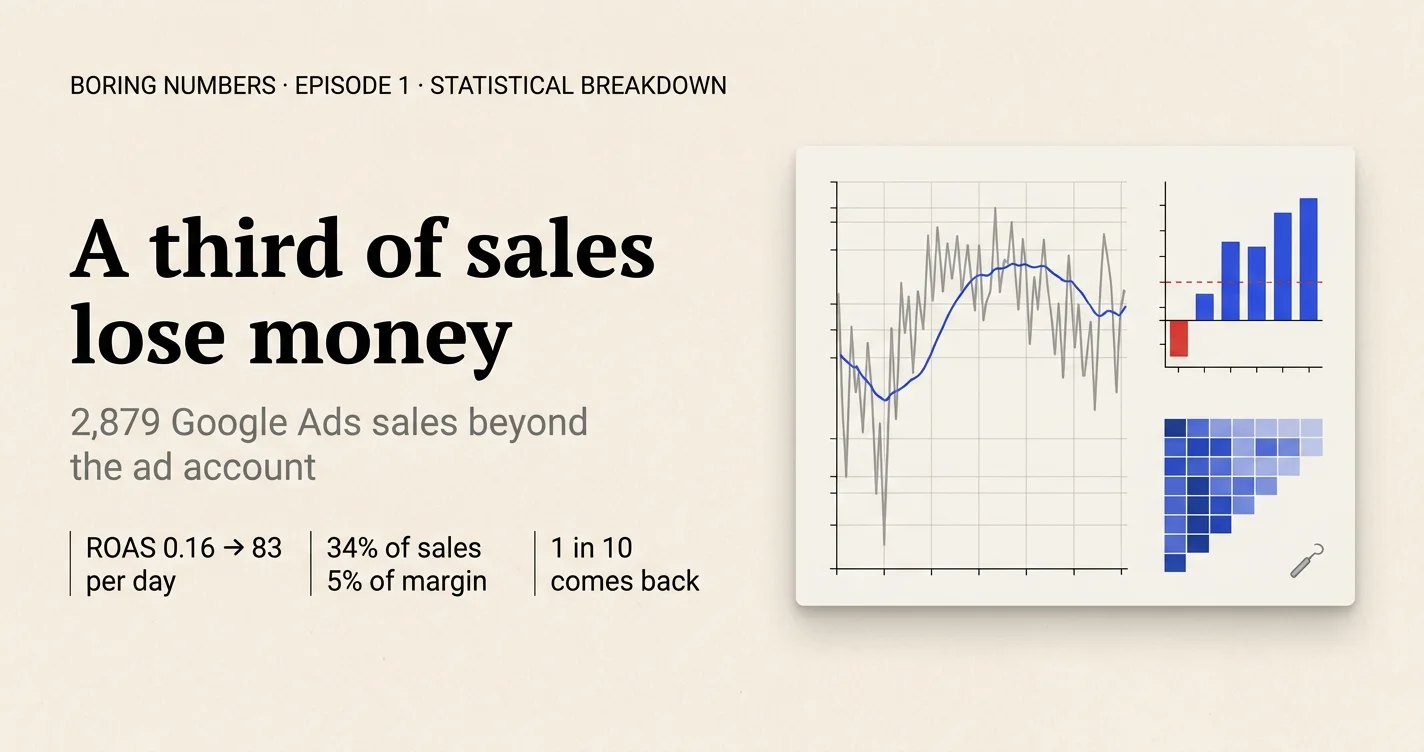
I am launching a new series, “Boring Numbers”. Here I take real projects apart in detail from a statistical point of view and draw conclusions at the end.
The format is boring, I warn you right away. But it is as useful as it gets. You will never see this in the ad account — and it can lead you to certain conclusions if you have a head on your shoulders.
Boring Numbers | Episode 1 — Equipment for Dentists

Case Study: Dental Equipment Store, ROAS 1577% (Google Ads)

Contents
- What the project is
- Daily ROAS is a cardiogram
- 37 days in the red, but every week in the black
- Dentists do not order on weekends
- Revenue is misleading
- The bitter truth: a sale got a quarter more expensive
- A third of orders lose money
- The bigger the basket, the more often people call
- Two hypotheses about the cheap basket
- “Volodya, it’s all over”
- The main conclusion
- FAQ
What the project is
An online store of equipment and supplies for dentists. The buyers are dentists and clinics, so it is essentially B2B.
I take March — September 2026. Ad spend was UAH 984,879 ($21.9K), and it brought 2,879 completed orders: 2,720 through the cart and 159 by phone. Revenue was UAH 11.1M ($247K), ROAS 11.3, margin minus ads +UAH 1.18M ($26.2K). One sale costs UAH 342 ($7.6) on average.
I count not the conversions in the account, but real orders from the CRM with the “Completed” status. The average margin is 19.5%, so the break-even ROAS here is 5.1.
Daily ROAS is a cardiogram
The first slides show how much you or your specialist limit yourselves when you analyze metrics by day or even by week and make decisions based on them.
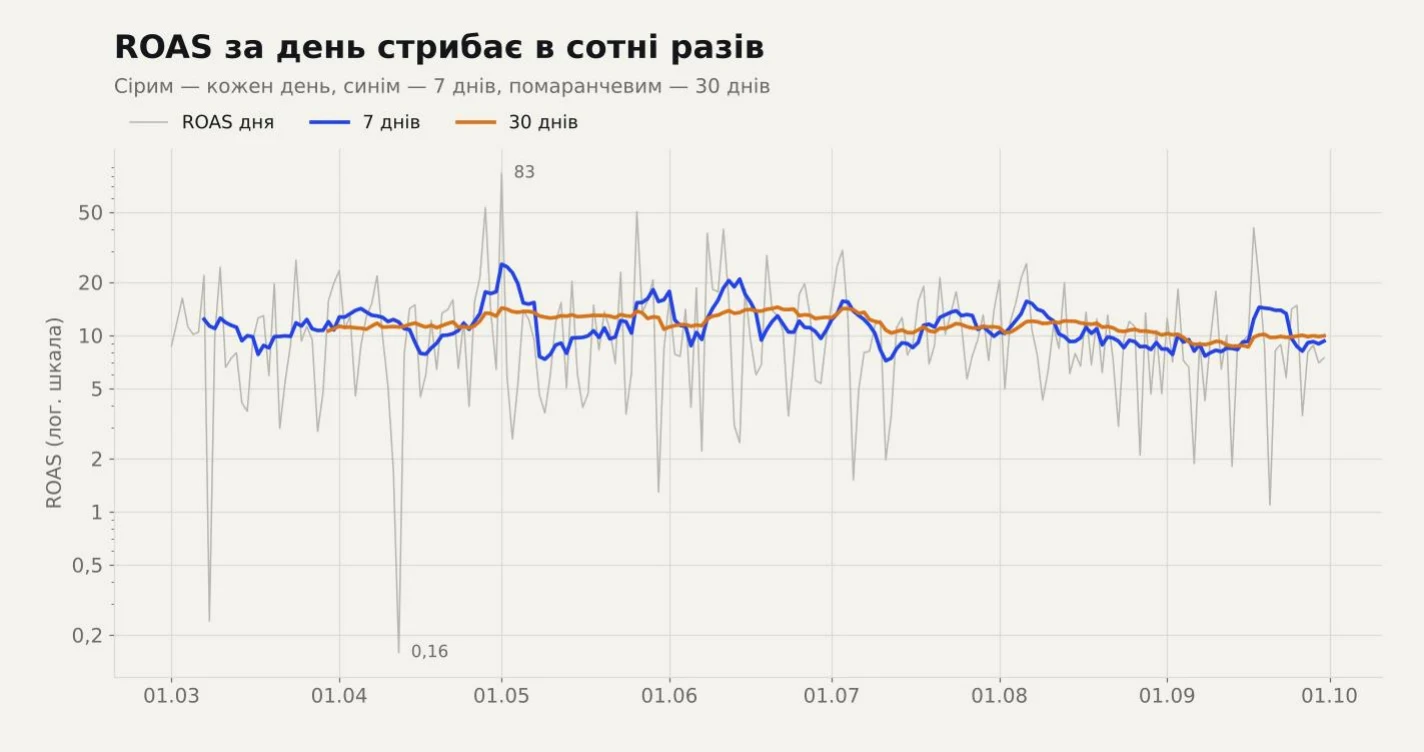
Daily ROAS jumps from 0.16 to 83 — like my cardiogram after my first heart attack. With data like this, you cannot make a sound decision about either the account or a single campaign.
Blue is the 7-day average. Better already, but the line is still bumpy: ROAS 8 in one place, 22 in another. Over 30 days all the jumps smooth out, and the line stays around 10–14.
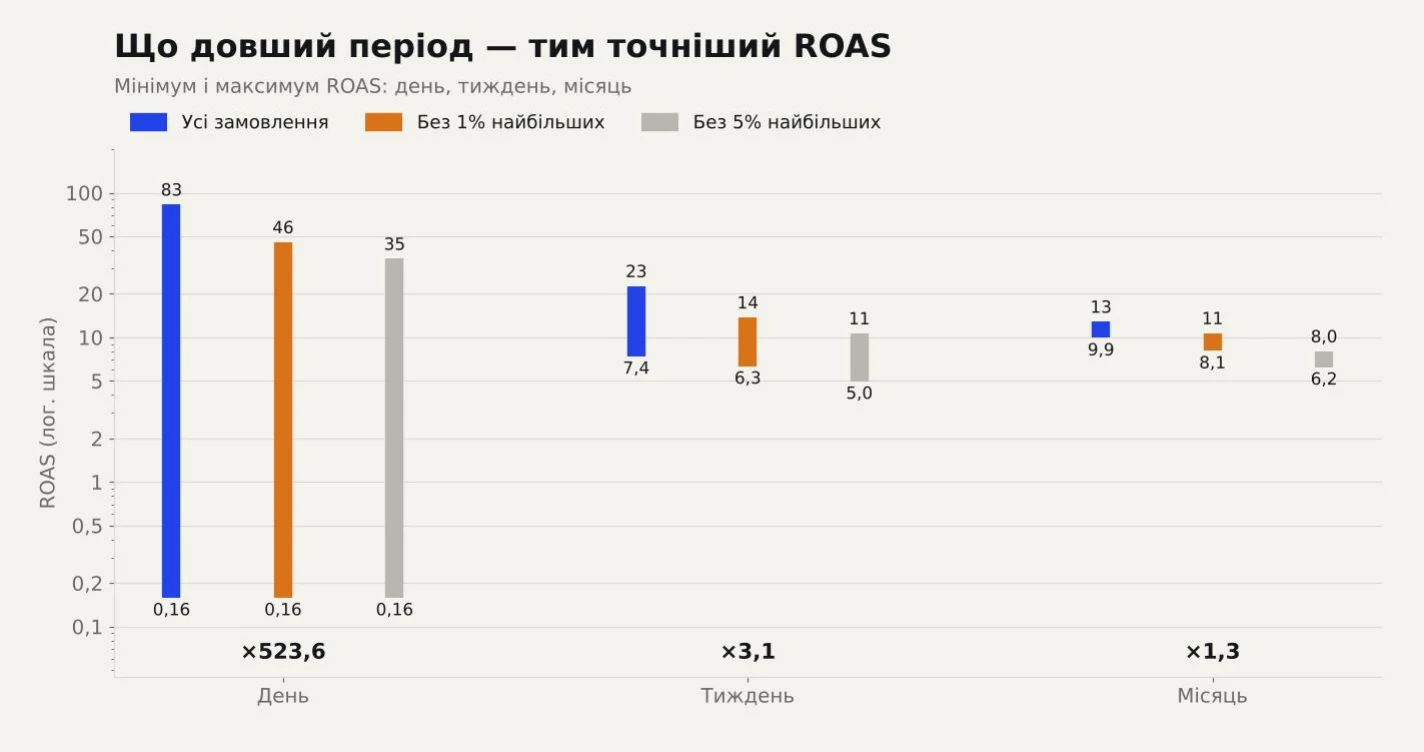
The spread by day is 524 times, and even without the 1–5% most expensive orders it is very high. By week it is 3.1 times, so even a week is too short to judge efficiency. Between months the difference is already about 30%. Not small, but it is not 500 times. The longer the period, the more accurate the analysis — for both ROAS and the number of purchases, the principle is the same.
Important: there are more than 400 orders a month here. If you have 30, you need years of statistics for balanced decisions. You can make a decision at any moment — the question is what the consequences will be.
 Google Ads · AnalyticsNonlinear Sales in Google Ads: 6 Reasons Why a Flat Line Is an Anomaly, Not the Norm5 sales one day, 10 the next. 6 systemic reasons for nonlinearity, with charts from 4 real projects.
37 days in the red, but every week in the black
Sales do not happen linearly — I do not see a single niche where they go evenly. Here 37 days out of 214 ended in the red, 25 of them Saturdays and Sundays.
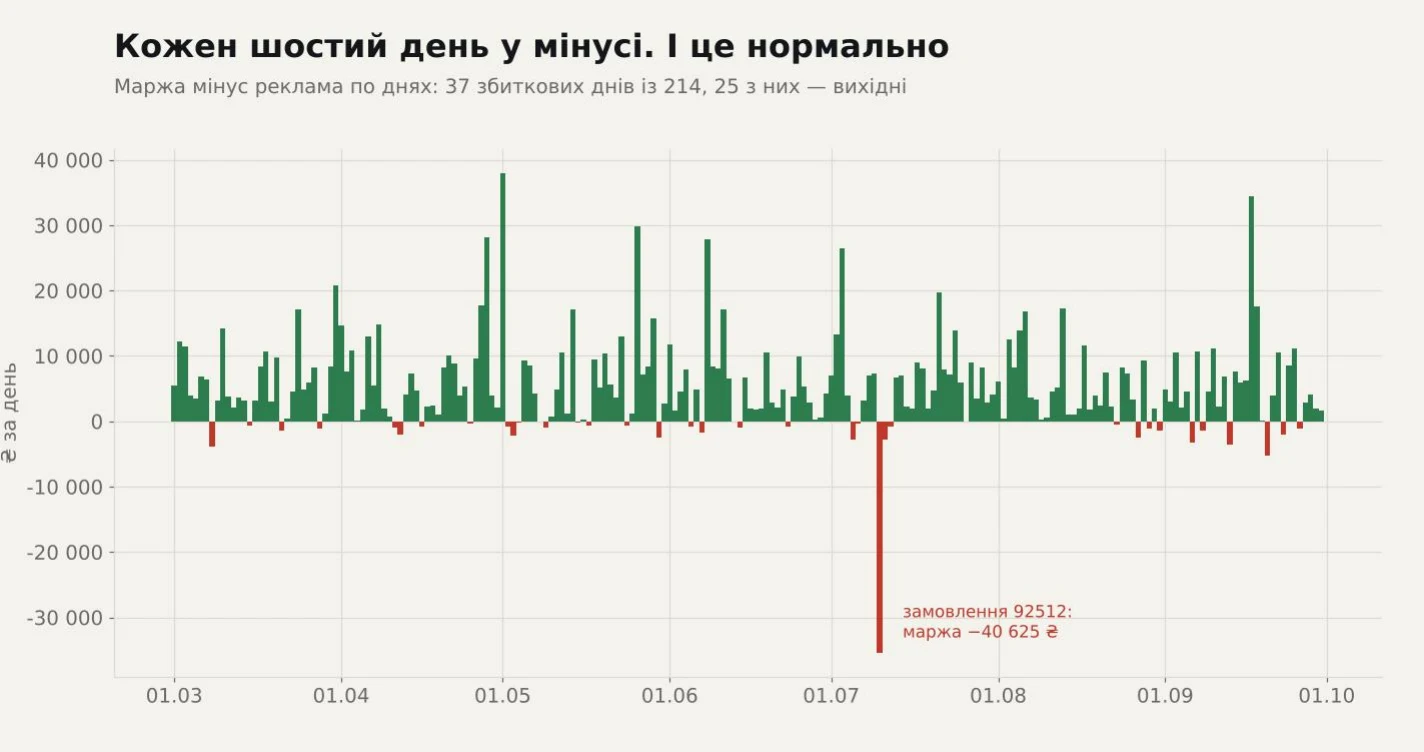
The big red bar in July is one order with a margin of −UAH 40,625 (−$903) on a UAH 24,875 ($553) sale. That does not happen; the data was simply entered into the CRM incorrectly.
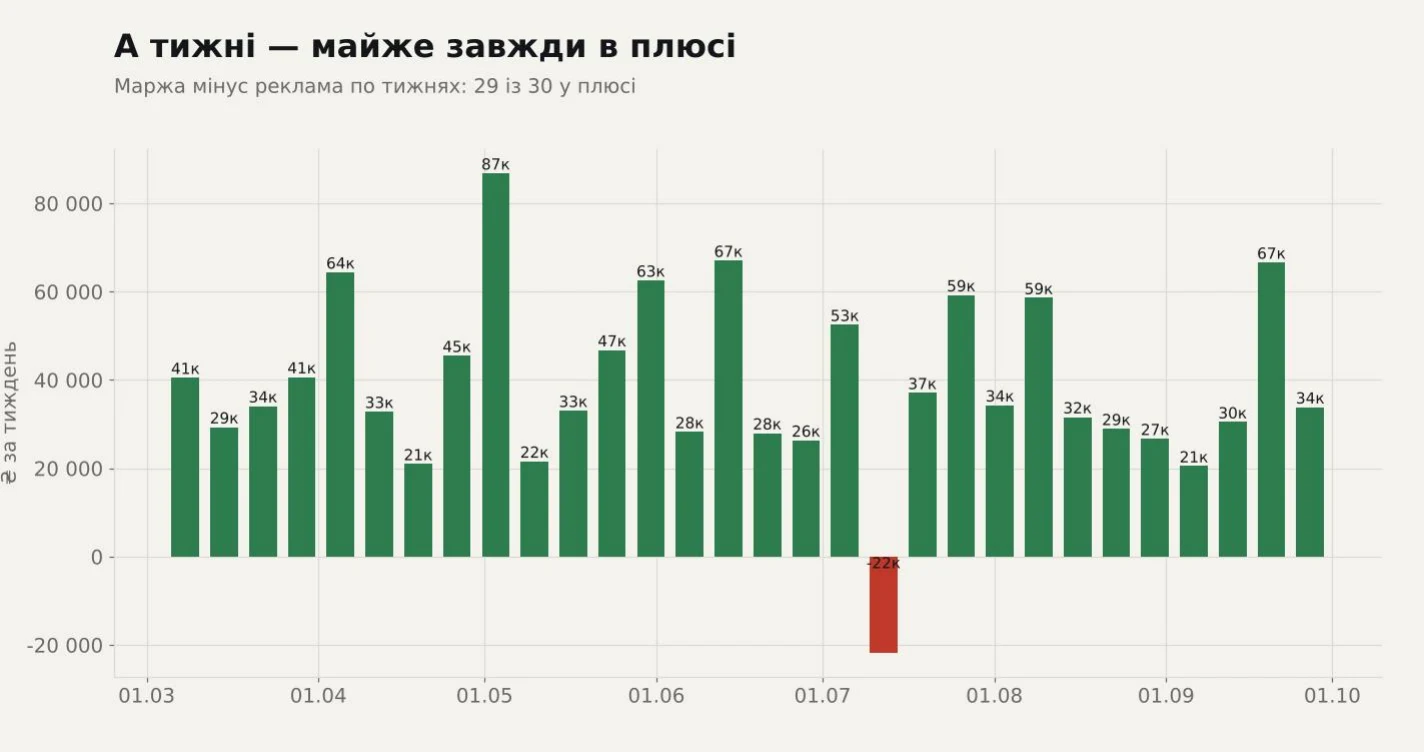
And not a single week ended in the red — the only dip came from that same order. The profit differs every week, a real roller coaster.
Do not expect a steady 10, 20 or 30 orders a day. In the next episode I will show a project with 4,500 orders a month — and there is not a single flat stretch in either revenue or order count.
Dentists do not order on weekends
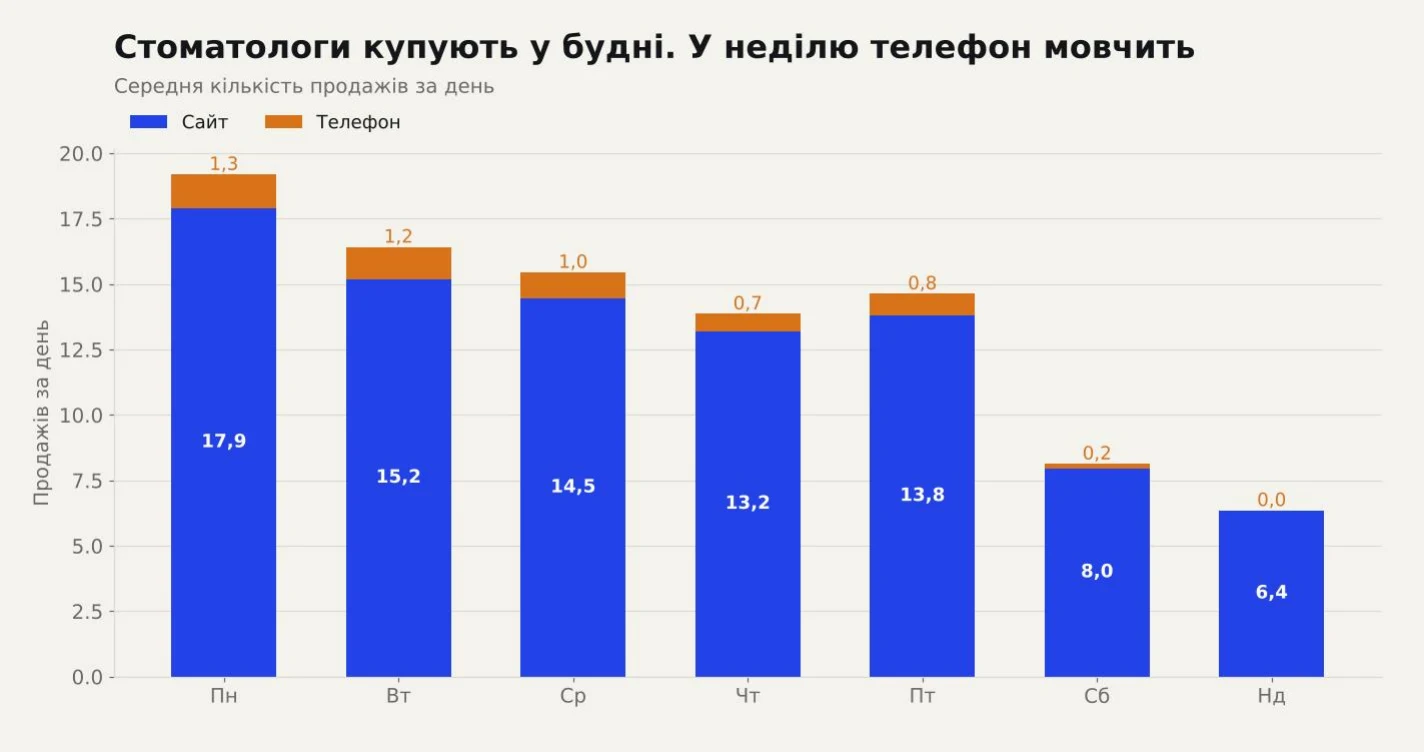
This is closer to Captain Obvious, but it is not that simple. Monday, the start of the week, averages 19 sales, then the chart declines toward the end of the week. Sunday has 6, and zero calls. Perhaps on weekends it is not the dentists who are off, but the people who order for them: administrators, office managers.
In money: weekends eat 24% of the budget and bring 14% of the margin. Sunday has a ROAS of 5.35 against a break-even of 5.1, and without the 5% biggest orders it is already in the red.
The obvious idea: “Let’s exclude weekends.” Two points. First, nobody knows how the campaigns will behave; only a 4–6 week test shows that. Second, there are two camps. Some say: if you do not work on weekends, do not run ads. I am in that camp. Others say the first touch often happens on the weekend, and people buy on Monday. I am in that camp too.
In the third episode, on electrical equipment with the same B2B audience, I did not speculate but overlaid two layers of data: the purchase date and the first click date. And I proved that there specifically this hypothesis does not work — there are neither weekend sales nor ones postponed to weekdays. There, weekends should be turned off. I am not generalizing — it is a specific case.
Revenue is misleading
There are some very big orders here that break the perception of the statistics.
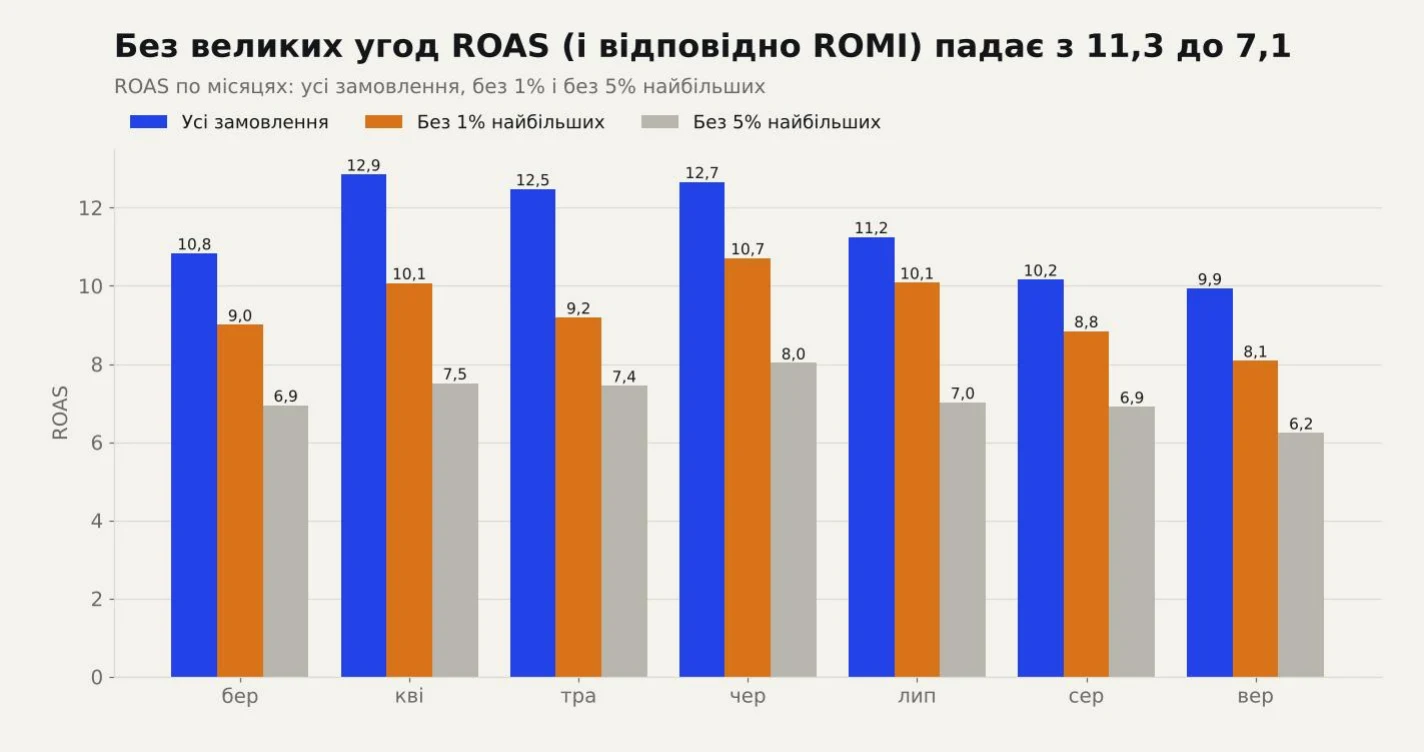
Blue is ROAS for all orders, orange is without the 1% most expensive, grey is without 5%. Without big orders the months are almost the same: ROAS roughly from 6 to 8.
For the period, ROAS is 11.3 → 9.3 without the top 1% → 7.1 without the top 5%. 29 orders (that same 1%) brought 17.6% of revenue. The record April (12.9) without its single biggest order is 11.6. The average order value is UAH 3,861 ($86), the median UAH 1,764 ($39). But even without the top 5%, margin minus ads is +UAH 501K ($11.1K): advertising pays off without them too.
Expensive one-off orders make the weather. And one-off stories are not about control but about chance.
By the way, this is exactly what “super cases” like to manipulate: they take a short lucky stretch and pass it off as the result. A case covering a week or a month or two is complete nonsense. You need to take long periods and show what it was like before. Because sometimes you join a project and there is not even a CRM — nothing to analyze.
The bitter truth: a sale got a quarter more expensive
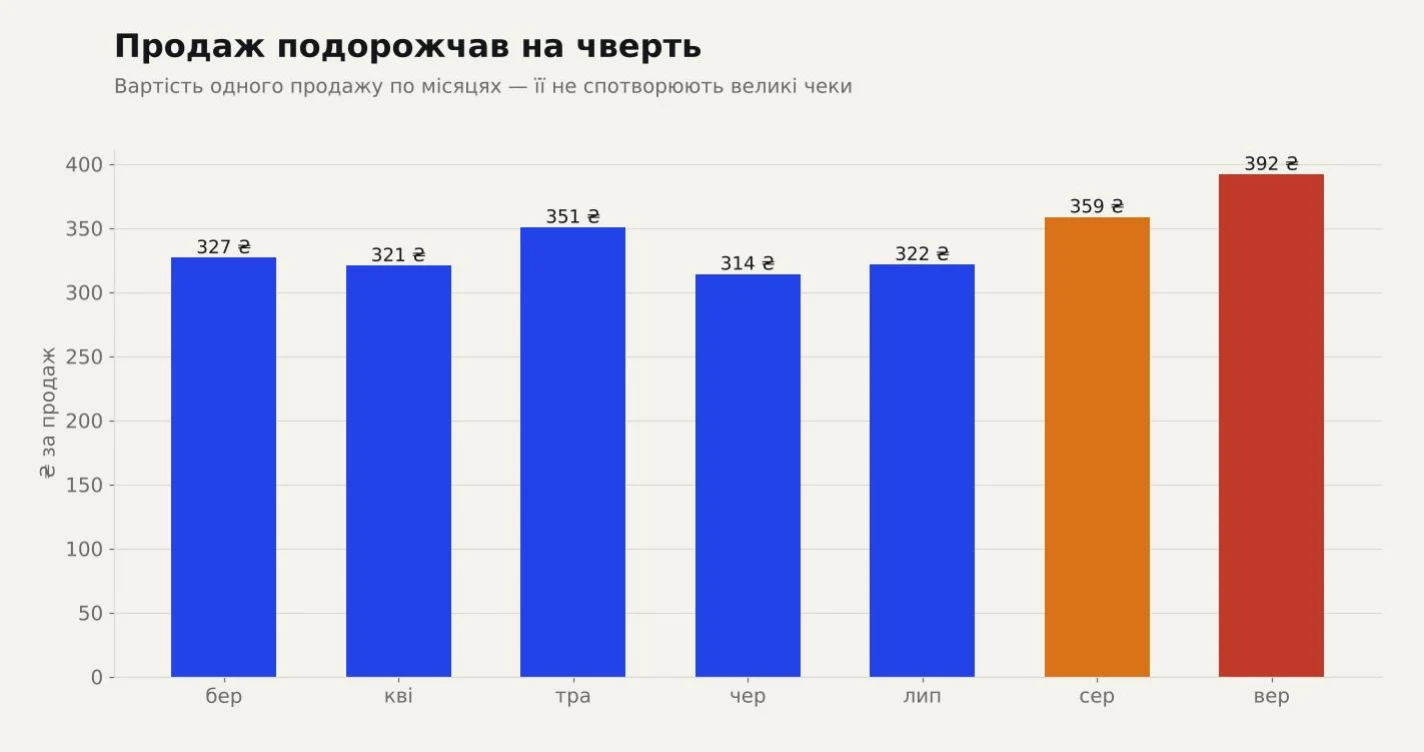
Somewhere in April I fully switched the ads to optimization based on CRM data — and it took off. Three months of great results. I overlaid spend on revenue and saw a correlation: I add budget bit by bit, and orders and margin grow proportionally. Well, a sign from above that it is time to push.
I will not say it was a mistake. But after that revenue no longer grew proportionally: roughly, I added 30% budget and revenue grew by 10%. The cost of a sale was UAH 314 ($7) in June and UAH 392 ($8.7) in September. That is +25% against random fluctuations of ±8% a month, so it is not noise.
Every project has a ceiling — the point where ad investment is most efficient. Above it, each next order gets more expensive and payback drops. This is where I hit it. I watch the trend by the cost of a sale: big orders do not affect it.
A third of orders lose money
Google Ads is an expensive channel. A cheap one is, I don’t know, handing out flyers. And it works very poorly on small orders, especially when the margin is mediocre, like here.
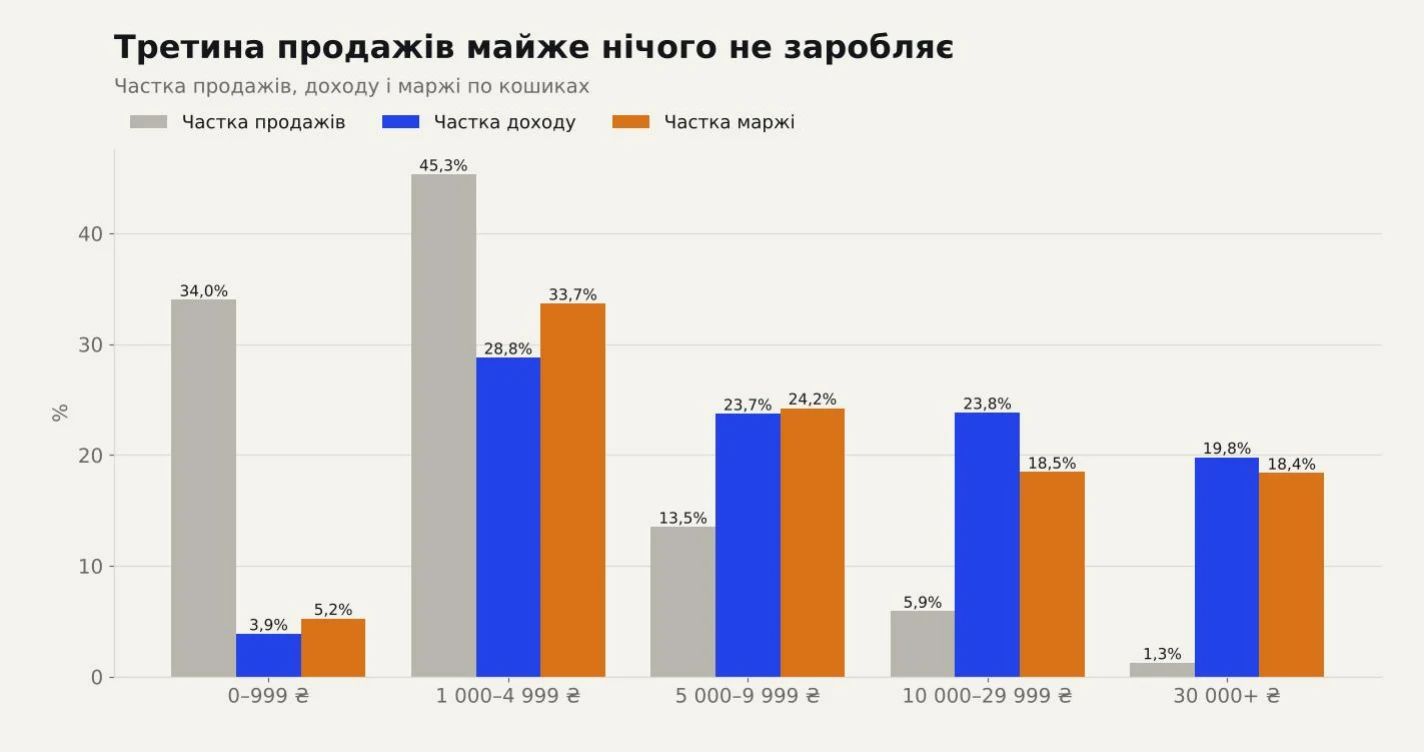
Baskets under UAH 1,000 ($22) are 34% of sales, every third order. And they bring 5.2% of the margin.
And the other way around: 1.3% of orders from UAH 30K ($667) brought almost 20% of the margin. Together with baskets from UAH 10K ($222), that is 7.2% of orders and 36.9% of the margin. 36 orders from UAH 30,000 ($667) bring as much as 170 orders of UAH 10–30K ($222–667).
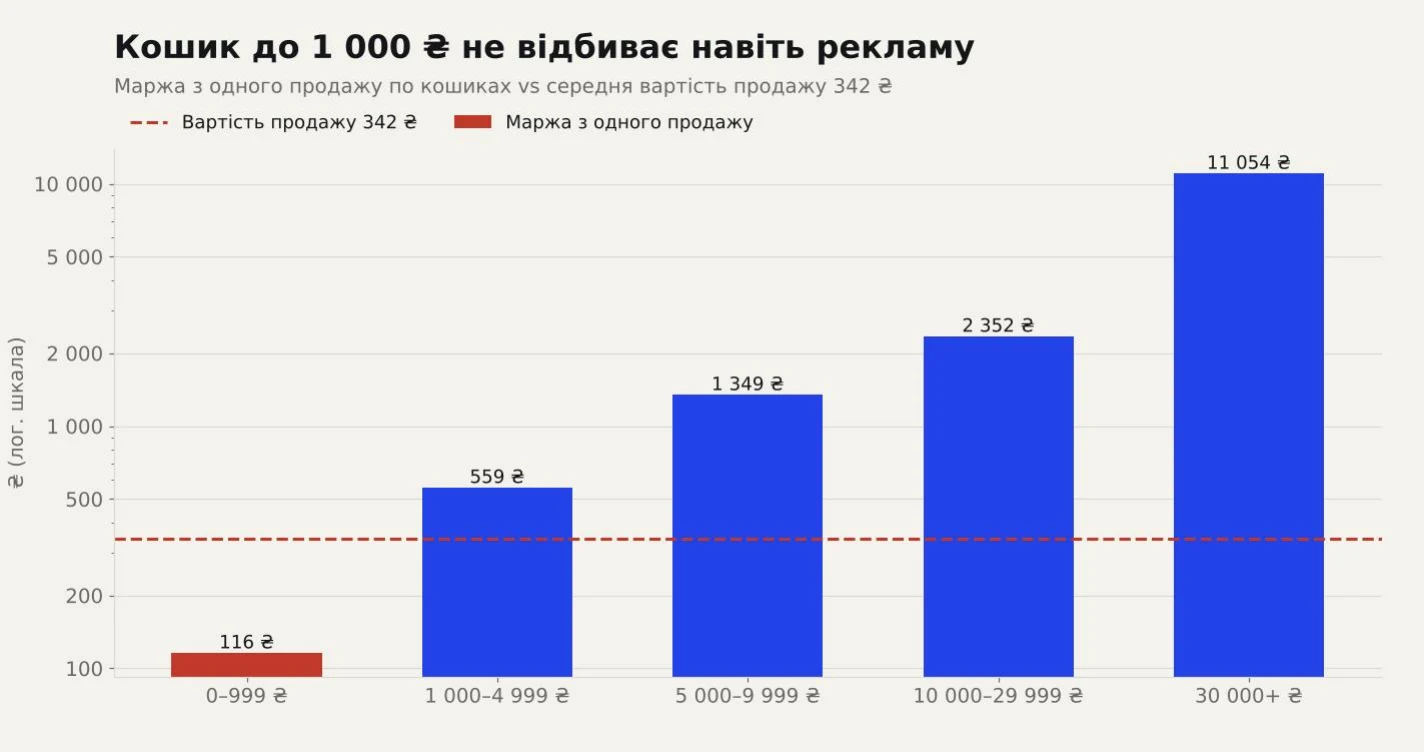
The red dashed line is the average cost of a sale, UAH 342 ($7.6). The margin from a small basket is UAH 116 ($2.6): it does not even cover the ads. From UAH 1,000 it is already UAH 559 ($12.4), and from UAH 5,000 ($111) the margin is many times the ad cost.
Splitting costs separately between cheap and expensive orders is impossible, so I use the average cost. Logically, a cheap one costs less. But with a threefold difference, the conclusion does not change.
And that is without operations: pack, ship, notify. And if the parcel is not picked up at the post office, there is also delivery there and back. On orders like these it is definitely a loss.
Pouring more into expensive products seems obvious, but there is a limit there too: demand, competition. Besides, expensive products are already advertised separately.
The bigger the basket, the more often people call
I made this breakdown specifically so I do not have to explain every time why you need call tracking if you sell expensive products.
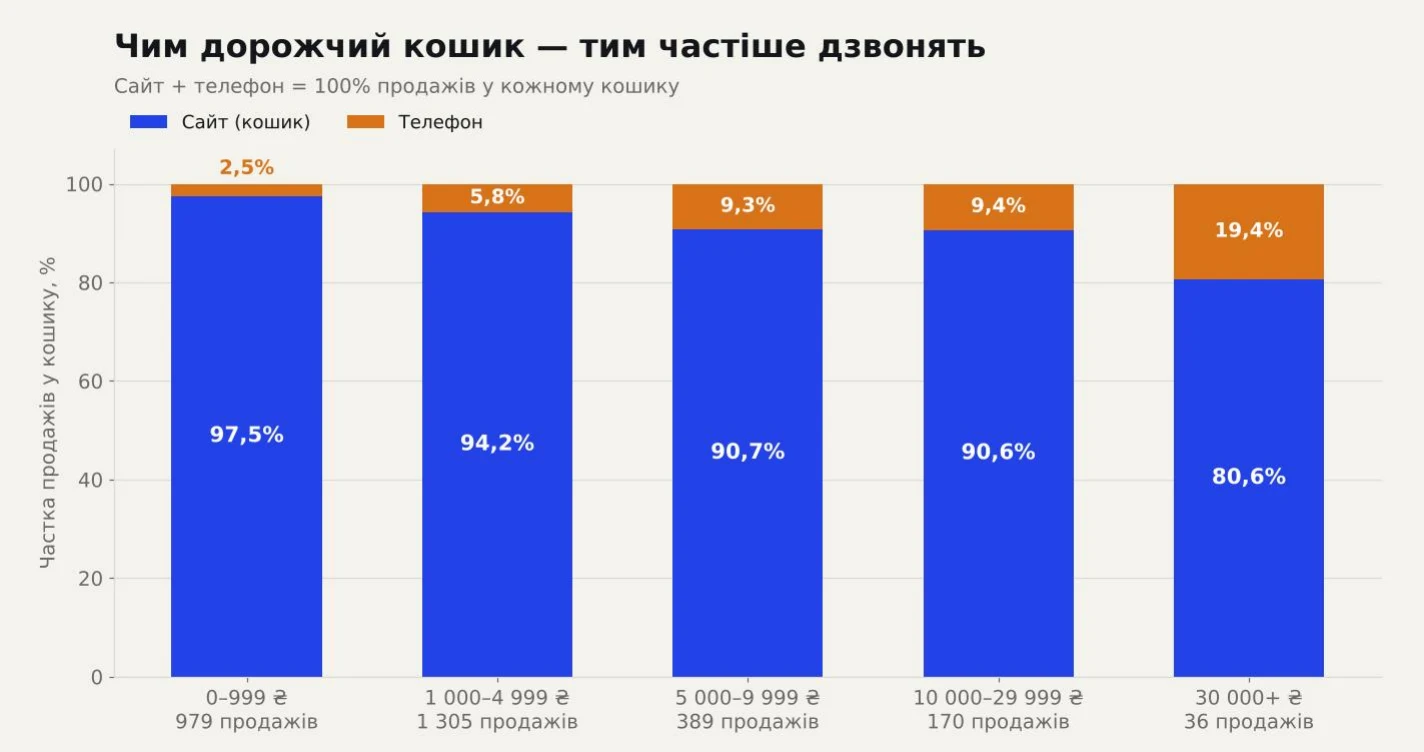
Every step up in order value adds calls: 2.5% in small baskets, then 5.8%, 9.3%, 9.4% — and 19.4% from UAH 30,000 ($667). In small baskets almost nobody calls, except out of urgency — they ran out of cement or blades.
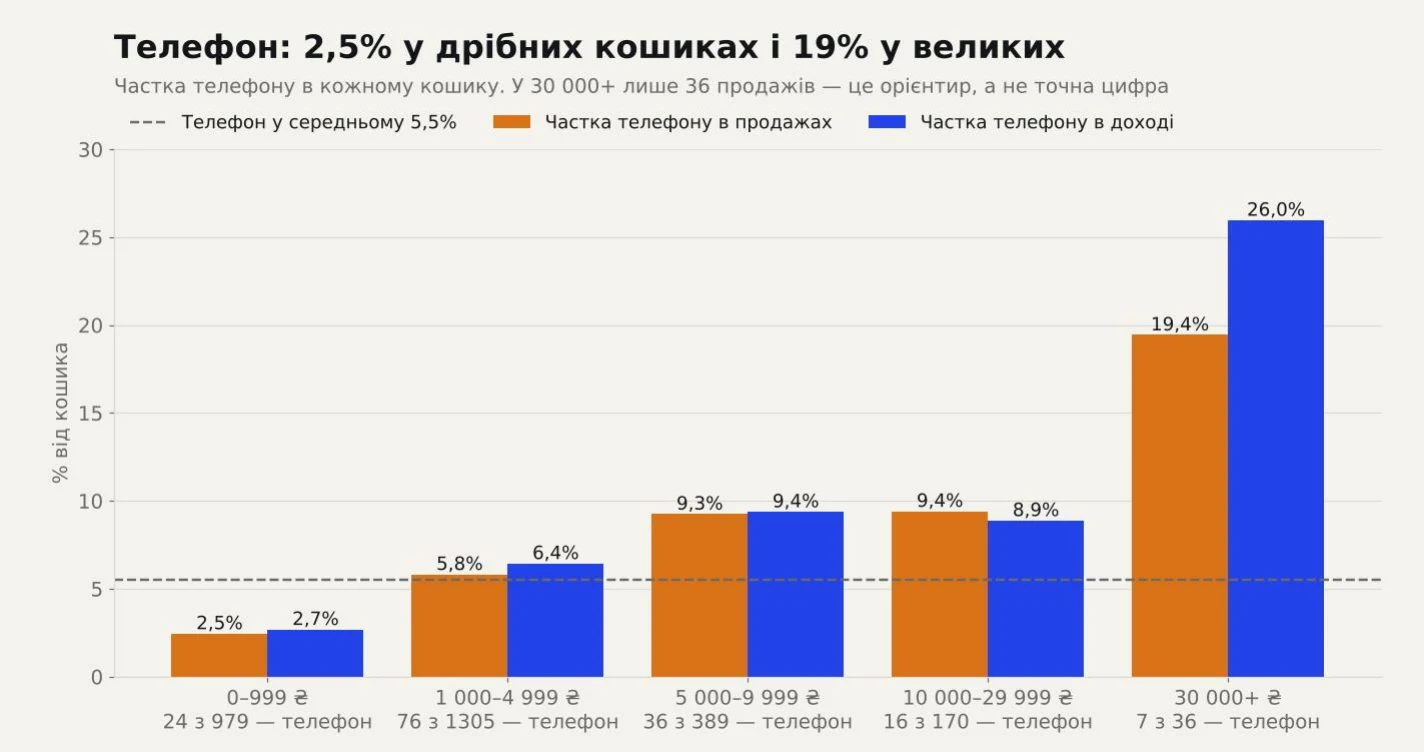
In the most expensive segment, the phone accounts for 19.4% of sales and 26% of revenue. Without call tracking you simply do not pass this data to the system, and it does not look for the same kind of people for you. And if you sell facade tiles with an order value of UAH 250K ($5.6K), nobody will buy from you through the cart.
From UAH 30,000 ($667) there are only 36 sales, 7 by phone. It is a guideline, but the trend is the same across all baskets.
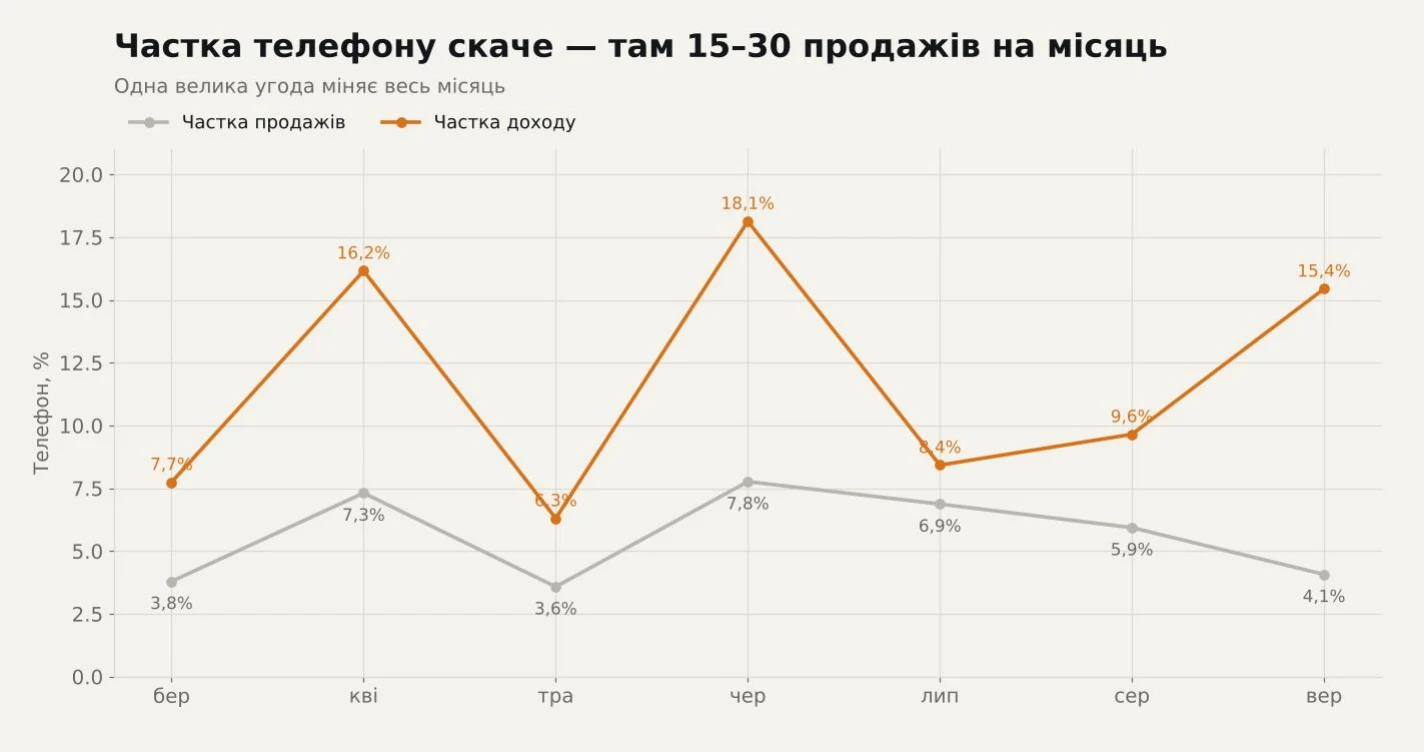
Overall, the phone is 5.5% of sales and 11.4% of revenue. By month, its revenue share jumps from 6% to 18%: one order can be UAH 150K ($3.3K) or UAH 20K ($444). 15–30 sales a month is very small statistics, with a margin of error of ±89%. You cannot build a trend here or tune separately for calls. Judge the phone only over a quarter or longer.
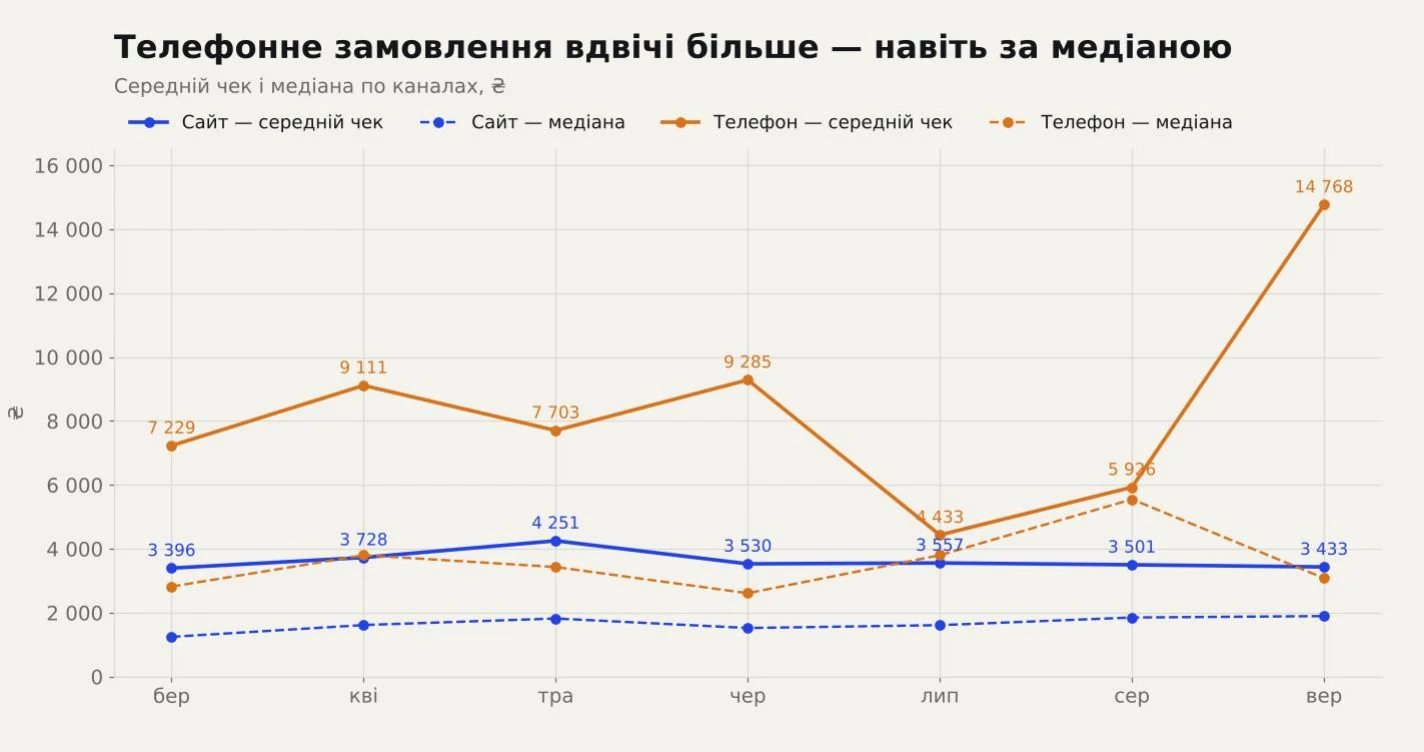
A phone order is bigger even by the median: UAH 3,480 ($77) vs. UAH 1,663 ($37). The average order value is UAH 8,000 ($178) vs. UAH 3,619 ($80).
On projects where orders range from UAH 200 ($4.4) to UAH 155K ($3.4K), I do not analyze the average order value. Look: the average phone order in September is UAH 14,768 ($328), wow. But there is one order of UAH 155,000 ($3.4K), and the median barely moves. When you think through offers and promotions, look at the median order value — it will tell you more about your audience.
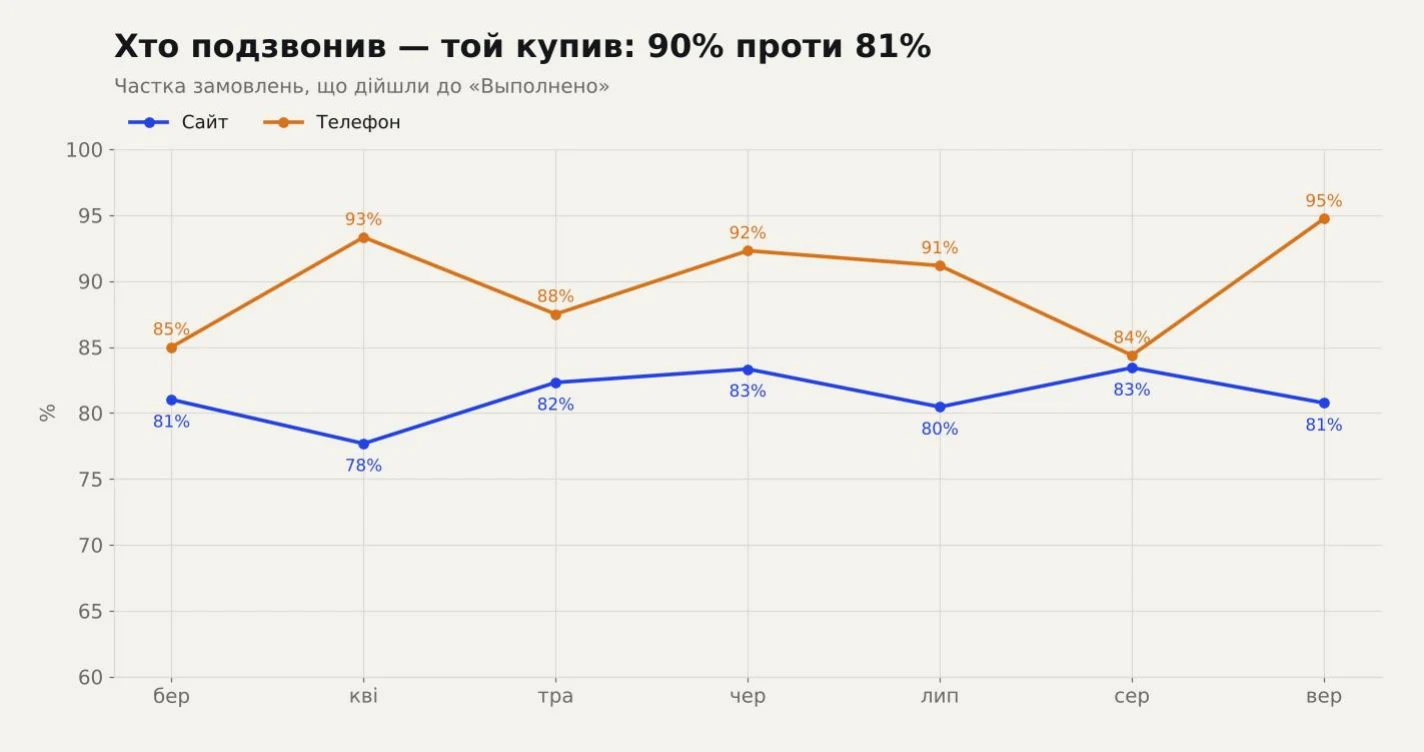
Those who called buy in 90% of cases, through the cart in 81%. A person who calls is already more committed. From the cart, every fifth order is unreachable people, some weirdos, people checking the price. That is why phone orders are more valuable. If you still do not pass calls to the system, you are losing a lot.
 Analytics · Google AdsThree Months Treating the Ads. The Front Desk Was SickA clinic marks qualified calls in Binotel, but never the missed ones. Because of this, Google Ads sees half as many leads as there really are.
Two hypotheses about the cheap basket
And here is what I was leading up to. I support these hypotheses myself, but a hypothesis must be confirmed or refuted. I stress: on this case, not on every case in nature.
The first is LTV. If a business lives on repeat purchases, cheap products are not excluded: dentists buy consumables often. You paid UAH 342 ($7.6) to acquire a customer, and by the fourth purchase the customer is already profitable. For many service businesses this is a survival strategy.
The second is growing into bigger orders. Today they buy a cheap product, tomorrow expensive equipment. Logical: if you buy consumables from one company, you already trust it.
The cheap basket does not come back
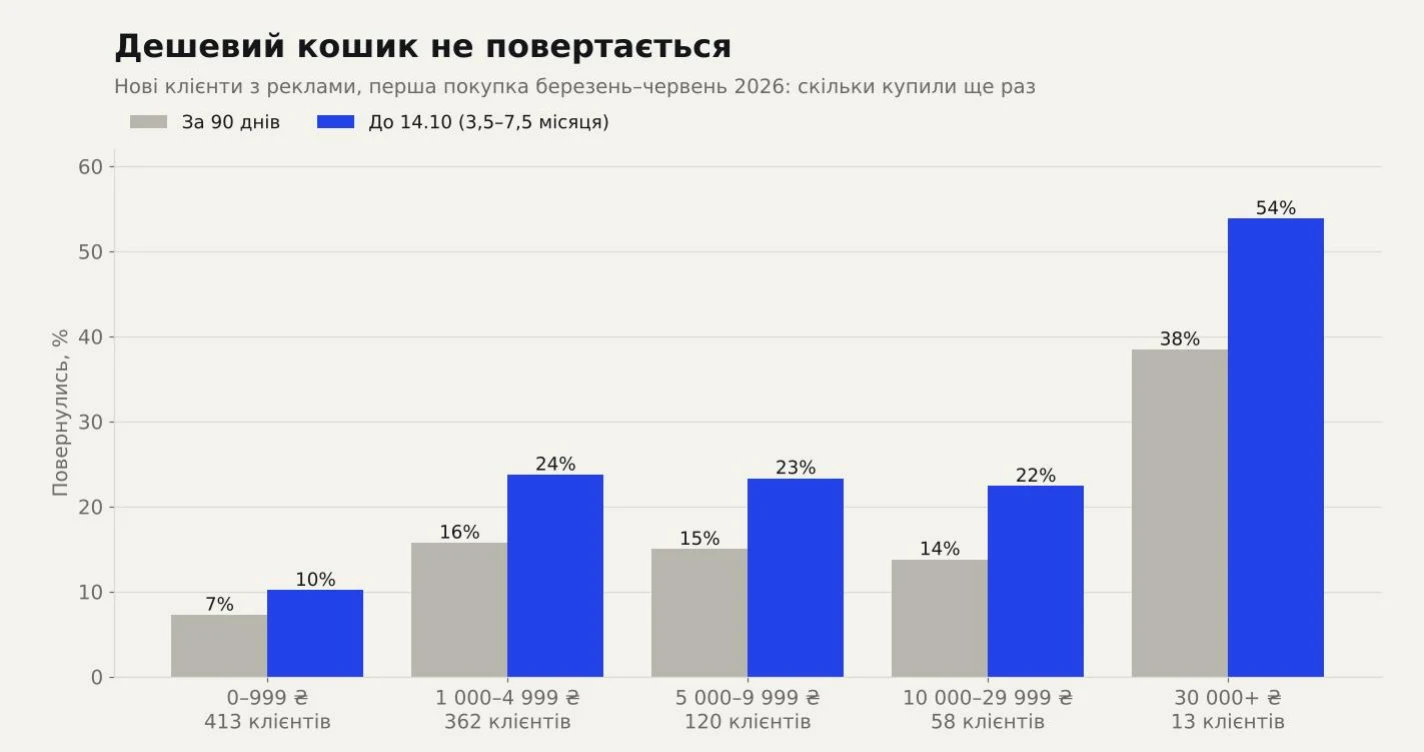
I count customers by phone number, with history from February 2025. New customers from March — June 2026 with a cheap basket: 7% came back within 90 days, 10% by October 14. One in ten. In other baskets, from 14% and from 22%.
So it is exactly those who bought expensive equipment who come back more often: later they buy consumables. Not the other way around. The LTV model does not work here. With all repeat purchases, a cheap customer brought UAH 183 ($4.1) of margin on average — against UAH 342 ($7.6) to acquire them.
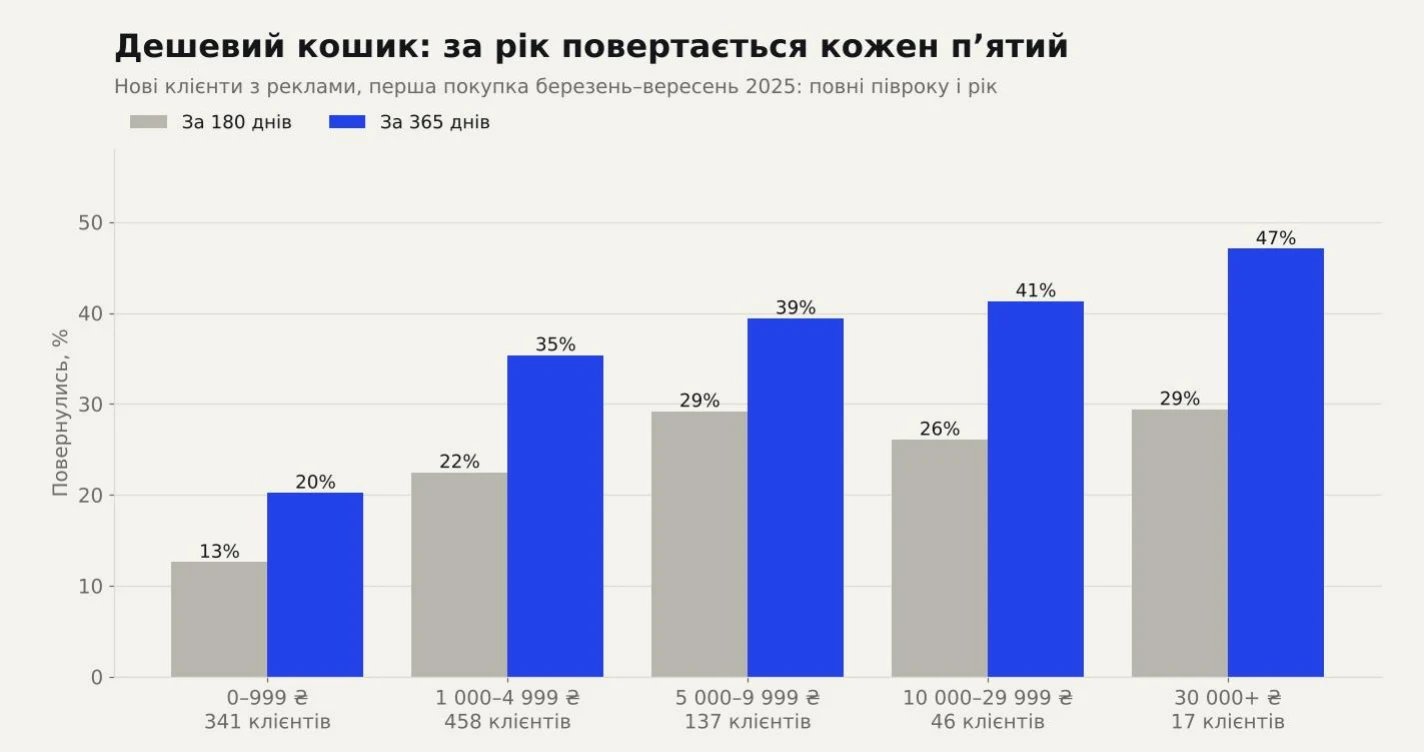
Maybe half a year is too short? I take 2025 customers and a full year: the cheap basket is 13% in half a year and 20% in a year, one in five. In other baskets, 22–29% and 35–47%. Over a year and a half, 24% vs. 40–62%.
Over a year, a cheap customer brings about UAH 1,170 ($26) in repeat purchases — that is ~UAH 290 ($6.4) of margin, ~UAH 410 ($9.1) together with the first purchase. Minus UAH 342 ($7.6) for acquisition and ads for the repeat purchases — about zero or a loss. Other baskets pay off many times over within a year.
One in five per year is little for a niche like this. Either customers go back to someone else, or repeat communication with the audience is not worked out.
The small basket does not grow into equipment
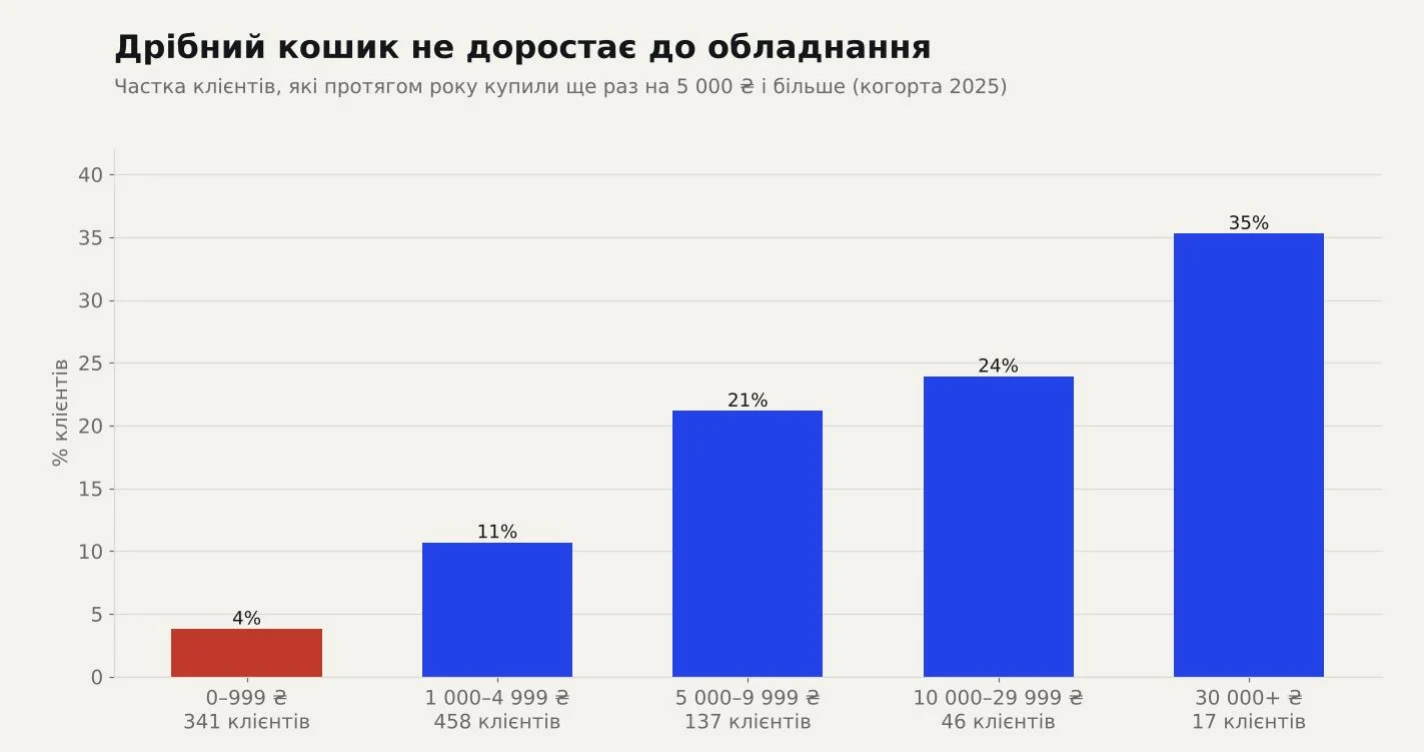
Bought again for UAH 5,000 ($111) or more within a year: 4% from the cheap segment, 11–35% from the others. Even over a year and a half, 7%. Statistically, that is insignificant. Besides, among cheap sales from ads only 24% come from people who already bought before; in expensive baskets it is 44–47%.
So if you bring in an audience through cheap orders and expect it to buy something for UAH 5,000 ($111) later, I have bad news for you.
“Volodya, it’s all over”
A client writes at 10 a.m.: “That’s it, Volodya, it’s all over, we’re bankrupt.” Because at 10 there are no orders yet. Or a day when there are fewer orders than yesterday.
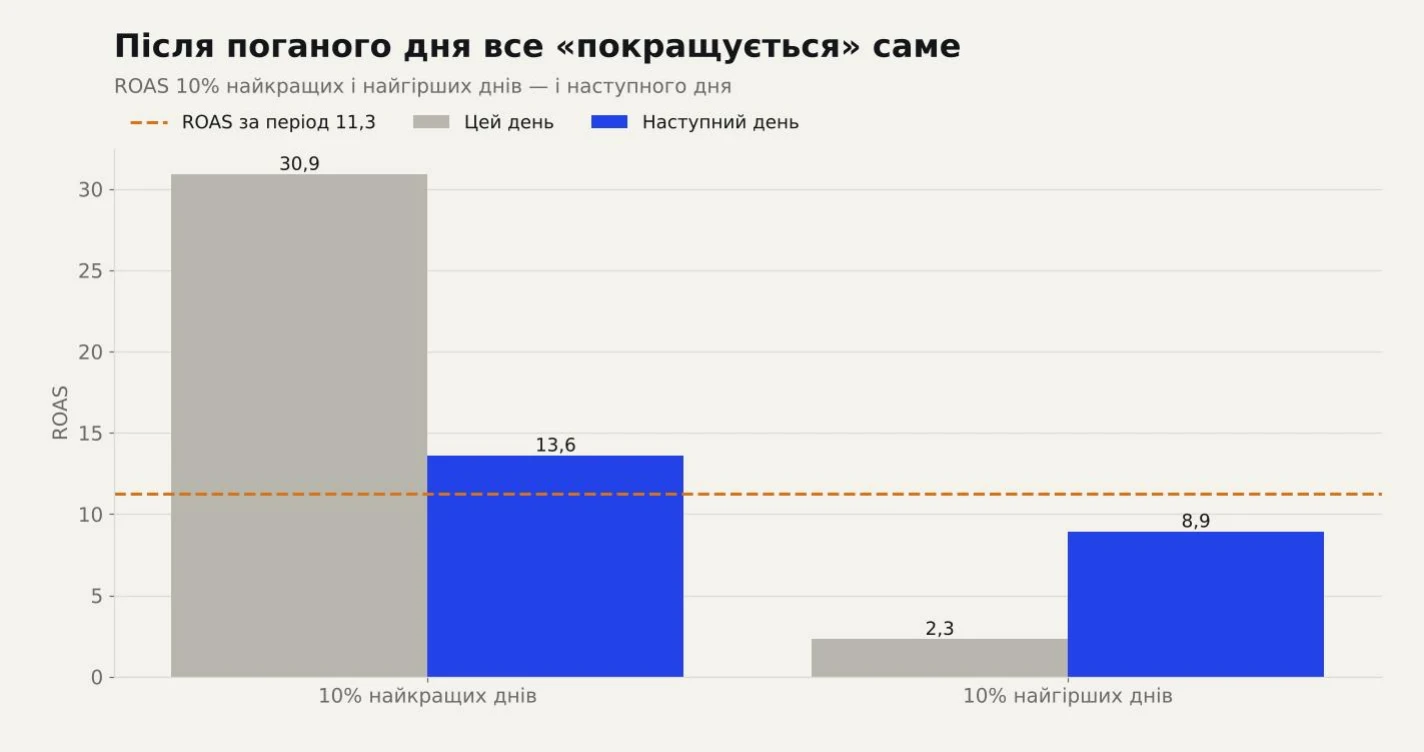
In this case, every bad day is followed by a good one. As Bodo Schäfer said, every winter is followed by spring. And vice versa — a super day is followed by a dip. The best 10% of days had a ROAS of 30.9, and the next day 13.6. The worst had 2.3, and the next day 8.9. The best week (27.04–03.05) had 22.6, the next one 7.8.
Nobody works in a vacuum; a pile of factors affects people’s behavior. So if you change something in the campaigns after a bad day, the next day will be better, and it will seem that it worked. But it would have got better anyway.
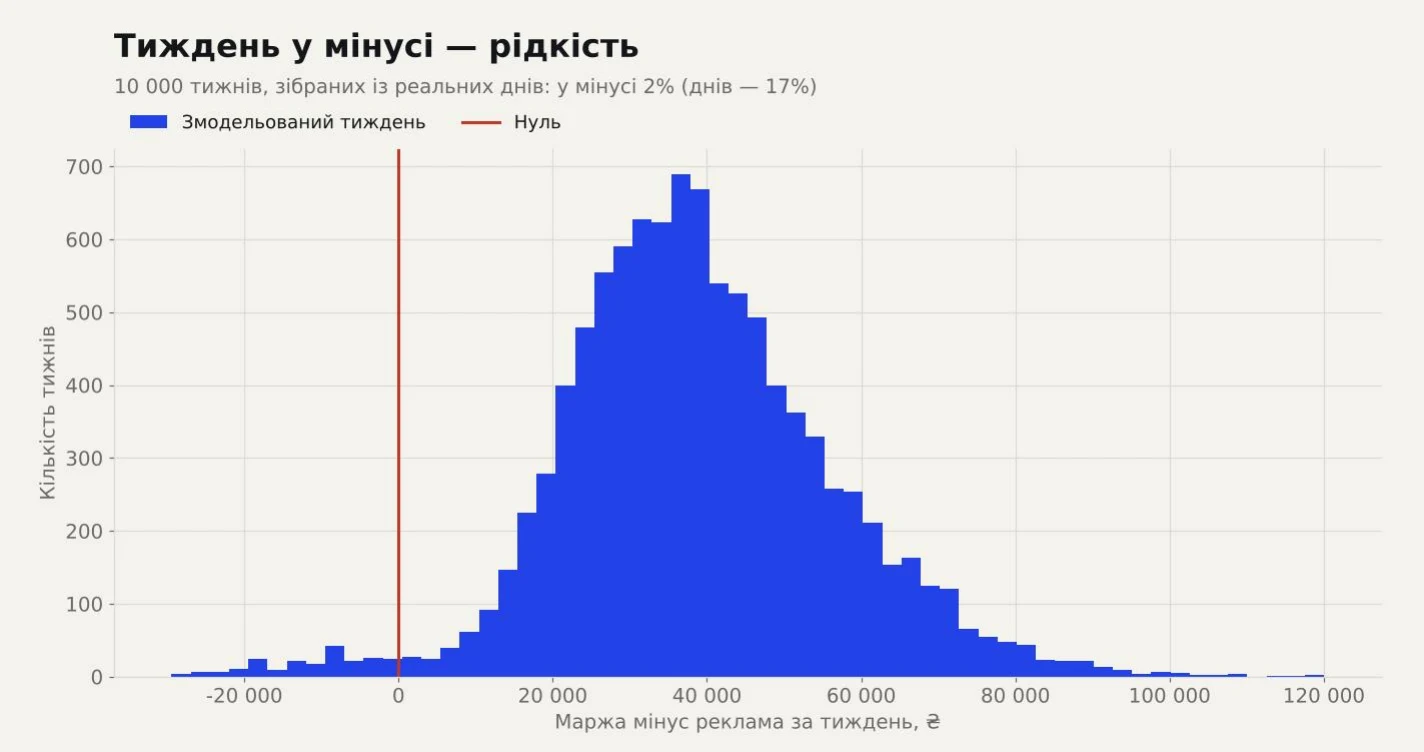
A week in the red is rare. Of 10,000 weeks assembled from real days, only 2% are in the red — against 17% of days. What do people do in such weeks? Panic, of course. But weekly data, as I have already shown, jumps around a lot.
And for fans of quick tests: here there are 13.5 sales a day ±3.7. To see a 20% change, you need about 37 days in each period — before and after. “30–50 conversions is enough” is a rule for strategy learning, not for conclusions: with 50 sales the ROAS error here is ±56%, over a month ±19%.
The main conclusion
Cheap orders are a story that does not pay off. This audience brings a loss even before the order, and when you process it, the loss grows due to operating costs. So it is worth raising the minimum order amount or turning off some cheap products in ads.
Yes, the person has already come and you have paid for them. But it is better to lock in the loss at the stage when they have not placed an order than to serve it and scale the loss.
And give these orders to competitors. Let them take them: statistically they will also get them at a loss and spend their own operating resources too. Let them scale this loss, not you. That is the main conclusion of this breakdown.
What else I would do here:
- bring the budget back to ~UAH 140–145K ($3.1–3.2K) a month and leave it alone for 4–6 weeks, not counting the first 2. Control: cost of a sale up to UAH 330 ($7.3); stop signal: fewer than 400 sales a month;
- narrow down cheap products as a separate step, not together with the budget. Stop signal: orders of UAH 1,000–4,999 ($22–111) drop;
- Sunday: reduce the budget or turn it off. In Performance Max, ad schedule adjustments do not work, only on or off, and the daily budget must be reduced, otherwise the money will flow into other days;
- set up repeat communication with customers;
- make decisions on months, by the cost and number of sales, not by daily ROAS.
The next episode of the series is about lead generation: 5,396 leads of a solar installation company and why B2C campaigns bring more B2B leads than B2B ones — in “Boring Numbers | Episode 2”.
Episode 3 of the series is about channels: Google Ads, SEO, Meta or TikTok, and which of them brings deals rather than just leads — in “Boring Numbers | Episode 3”.
You can check how much noise there is in your own account’s daily and weekly numbers using your Google Ads export — the Conversion & ROAS noise tool.
Where to find me
Message me on Telegram or by email — I respond quickly. Telegram channel and YouTube are for those who want to see real cases before reaching out and understand my approach.