
Marketer, analyst, ex-CMO focused on the Google ecosystem (Ads, Merchant Center, GA4, GTM). Google Partner. 150+ projects, 100+ positive reviews on Freelancehunt, 12+ countries.
- I work directly, with no account managers or subcontractors
- I measure results in sales, not in-platform conversions
- Maximum expertise in the Google ecosystem — instead of “PPC, social ads and SEO, all in one”
Episode number 2 of “Boring Numbers”. No video this time — there will be slides from the presentation and my comments.
And right away, an important point for the “roosters” who say all this stuff is AI-generated: I can only show you my middle finger. All my content on the site is my own. Of course, AI helps me — for example, with preparing and processing large data sets. Otherwise I would physically spend most of my working time on it.
Do I check this data? Of course. With AI you have to think like a manager, and one of the functions of a good manager is control. You cannot blindly trust whatever AI has calculated.
Contents
How to Separate B2B and B2C in Google Ads and Improve Lead Quality

About the project
I have been working with this project for a year and a half. The company is on the Forbes Ukraine list, and from a marketing point of view they are really good: they invest in the brand and use everything possible in marketing. I see this quite rarely. And, frankly, that is why their numbers are excellent.
I do not publish revenue figures here — they are not needed. Many channels are involved, but this breakdown covers only Google Ads.
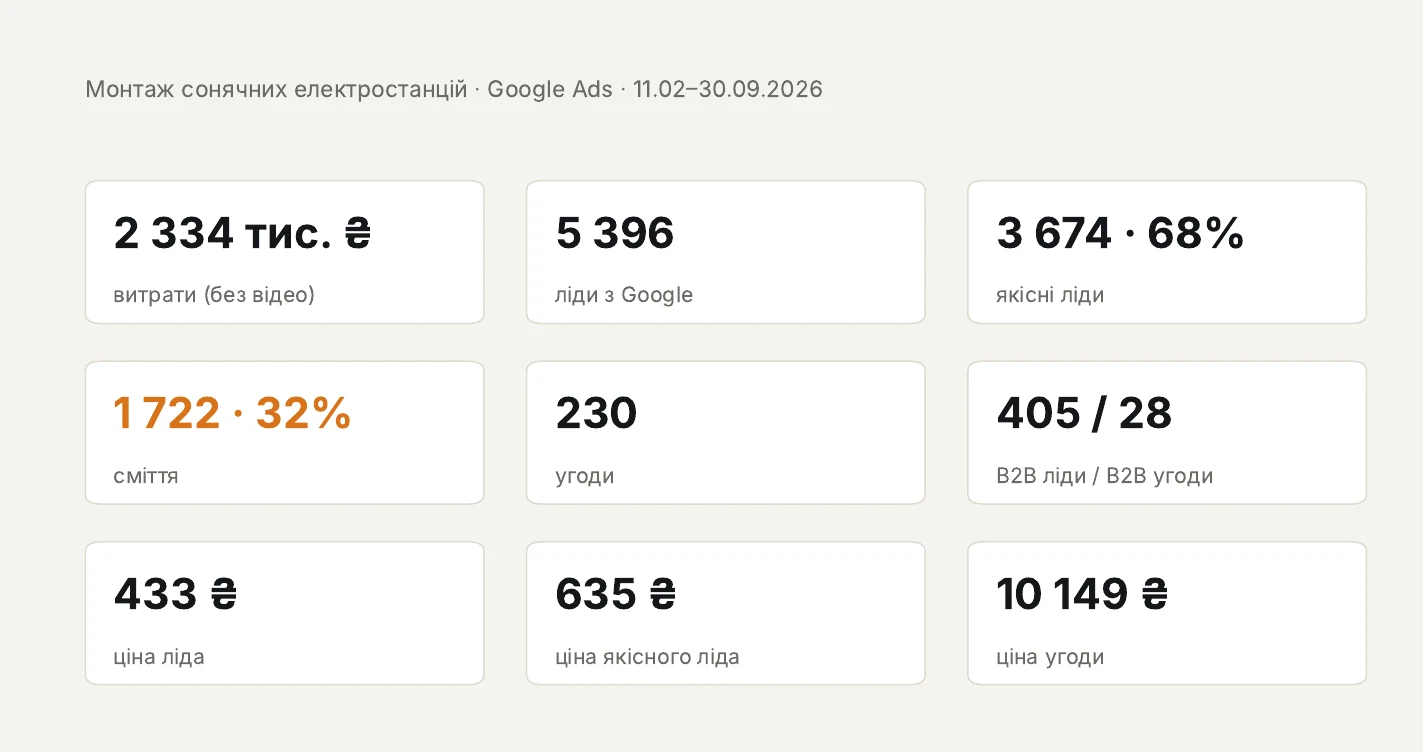
Over the period, spend exceeded UAH 2.334M (~$51.9K). We got 5,396 leads, 68% of them qualified.
It may seem that 68% qualified leads is low. I do not know what “low” means. If 68% qualified leads cover the business’s needs and allow it to be profitable, it is a good result.
The other 32% I have labelled as junk. But not all of it is junk — I will break it down further on.
The cost of any lead that came in is UAH 433 ($9.6). The cost of a qualified lead is UAH 635 ($14.1). A qualified lead is a lead that is not unqualified. The cost per deal is when you have done your job and the check has been closed with money. To an unprepared person without analytics, this may seem like a lot. But, friends, set up end-to-end analytics — then you will understand how much a sale really costs you.
A case right away. Some guys selling expensive premium tiles came to me. The minimum order is from UAH 250K ($5.6K). They ask how much a lead will cost. I say: expensive. They: “We want a lead to cost UAH 500.” So do I. If someone gives me leads at UAH 500 in a premium niche with a UAH 250K order value, I will be incredibly happy. But that does not happen in such niches. The cost of a lead has to be assessed objectively, not built on illusory numbers.
How much junk there is in B2B and B2C
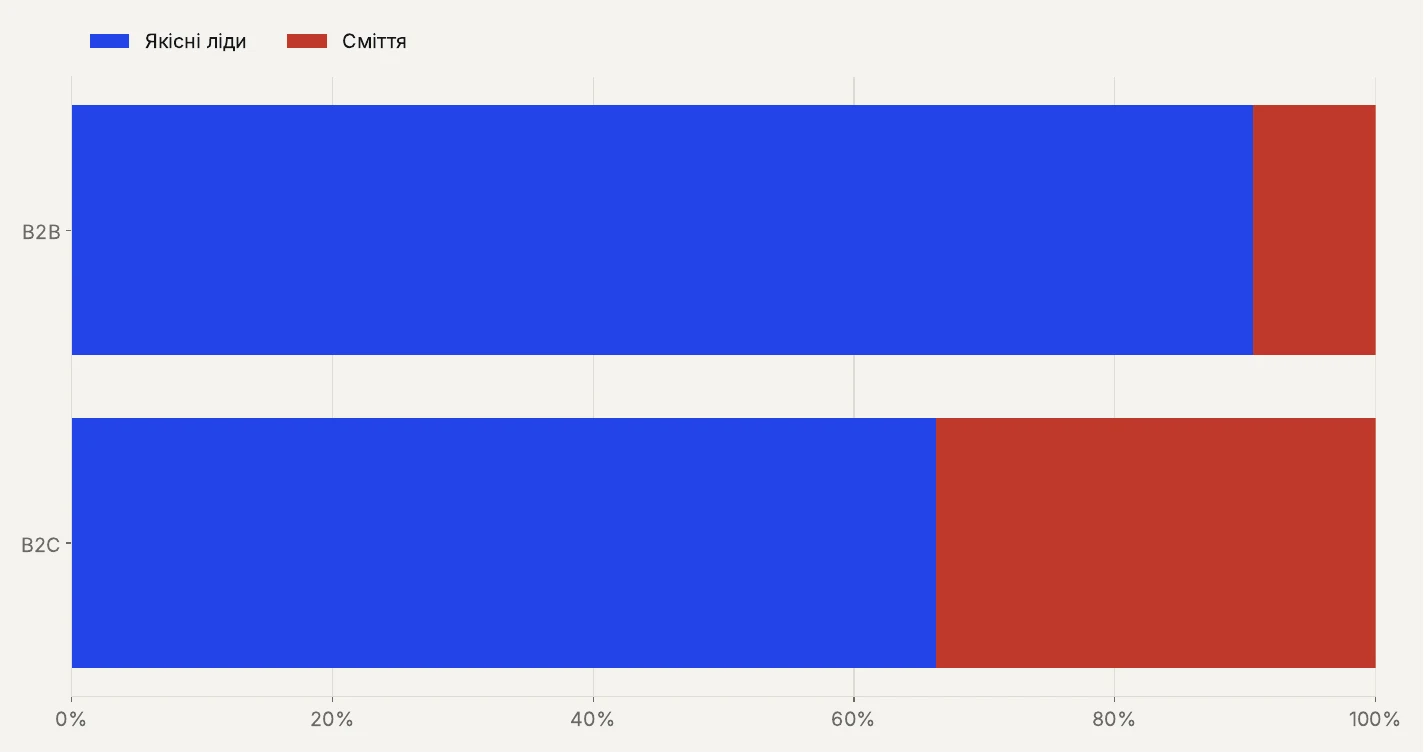
A bit of context. We split leads into B2C and B2B in the CRM itself and send them to Google Ads as separate signals.
In the B2C segment, junk is about 30–37%. At the same time, 9.4% of B2B leads were also classified as junk.
With B2C I understand: there can be some random requests. But in the CRM a lead is marked as B2B only when a manager has qualified it as a business client. How can it become junk after that? I will not analyze how the sales department works here — that is more their question.
Overall, the slide shows that the main flow of junk is in B2C. But here, too, it is not that clear-cut.
What the junk consists of
This slide is very important.
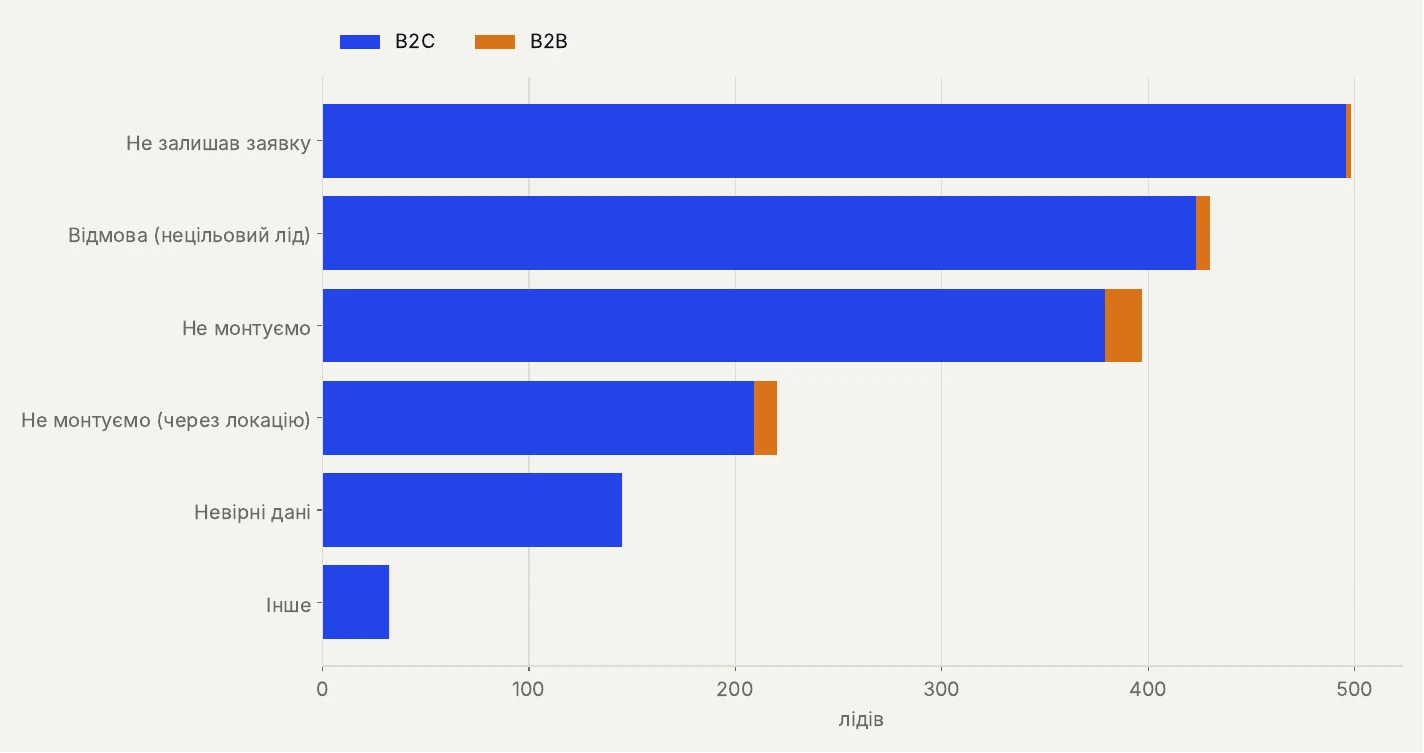
There are six statuses here, and I would split this whole pile into several parts.
The first is invalid leads. It is important to separate invalid leads from non-target ones. This is needed to make the analytics clearer. Leads that did not leave a request or left wrong details are not unqualified leads. You cannot tell whether they are qualified or not, because they are invalid. So this block should be a separate item in the CRM. We understand that there is a pool of leads that did not leave a request or left wrong details. This concerns traffic quality, without a doubt. But not lead quality.
The second is two extremely interesting statuses: “We don’t install” and “We don’t install due to location”.
Let me explain. A lead calls, say, from a remote village in the Vinnytsia region. This region is in the geotargeting and defined as a target. But for some reason the company cannot or does not want to go there to install a solar plant. And the lead goes into unqualified: “we don’t install due to location”, for reasons beyond our control.
“We don’t install” covers leads that need, for example, two panels installed on a balcony — and that is it. The company does not do such installations, and the lead is considered non-target. I would also classify it as non-target.
But there is a big “but” here. I have two clients. One of them uses organic traffic to attract people who buy solar panels on his site. He works on a dropshipping model, and he is not interested in selling 1, 2, 3 or even 10 panels — he is interested in selling by the pallet. He does not even spend time on such people: he set up a bot that talks to them. I say: “Dude, I have guys who can take these 10 panels from you and install them for the customer. Let me connect you.” And now they exchange such requests on a commercial basis. He has requests he cannot or does not want to serve — and he passes them to those who can.
They should not be thrown away. They have already come to you, and almost for free. In the same way, this company can sell to contractors those it does not install due to location and get additional income. The same goes for the “We don’t install” status: 100% of companies that install solar plants have subcontractors who can handle these jobs.
Junk by month
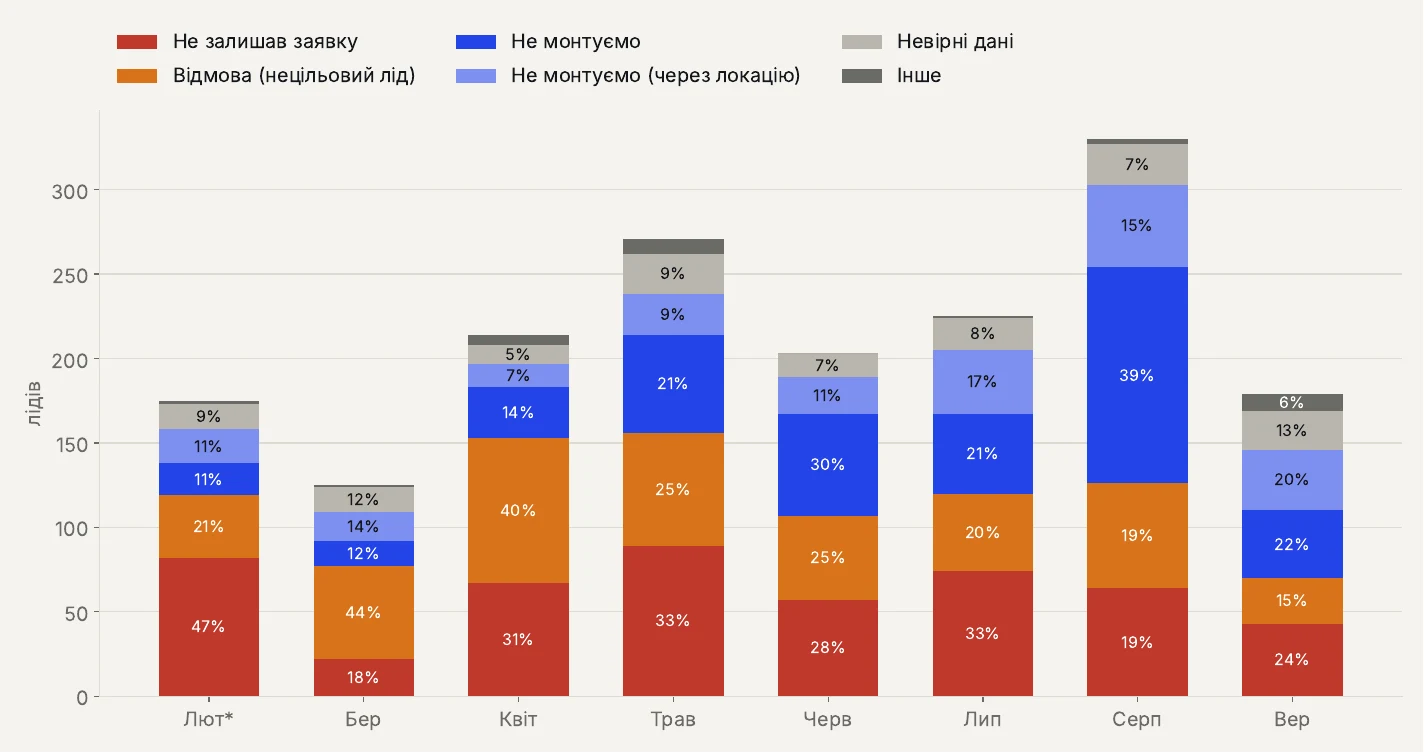
I broke all the statuses into histograms to see whether there is any trend at all.
Take, for example, “Did not leave a request”. The figure jumps from month to month: 18% in March, 47% in February, 33% in May, 19% in August. A 2.5-fold spread from the minimum to the maximum.
What does this suggest? Advertising has been running here for a long time and more or less stably. I have no confirmation — I am not the head of sales at this company and I do not control the managers. But based on this data, I get the impression that there is some subjectivity or a lack of a standard for evaluating leads.
We have run into this several times during our cooperation. There are more than seven statuses for unqualified leads, and managers get confused about where to put these leads. For example, there is “Rejected (non-target lead)”, and there are “We don’t install” and “We don’t install due to location” — essentially these can mean the same thing. The same goes for “Did not leave a request” and “Wrong details” — why separate them, I do not know, and who uses this for analysis. A lead is invalid either because they did not leave a request or because their details are wrong. These can easily be merged so you do not waste time building hypotheses later.
Cost per lead and cost per qualified lead
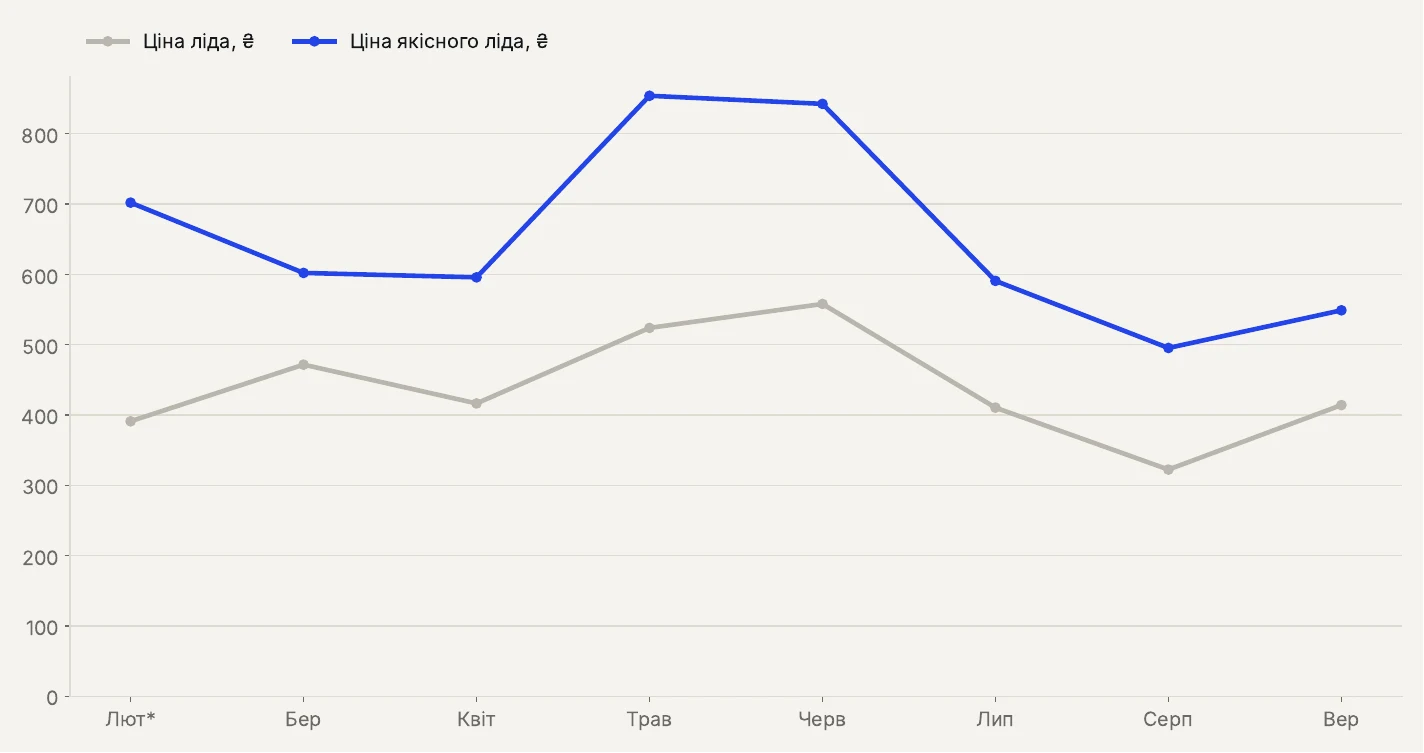
Honestly, I do not know why the heck I added this slide — it is not very informative. It shows a correlation: cost per lead and cost per qualified lead move together. I did not calculate the coefficient here specifically; by eye, about 0.85.
Cost per deal by month
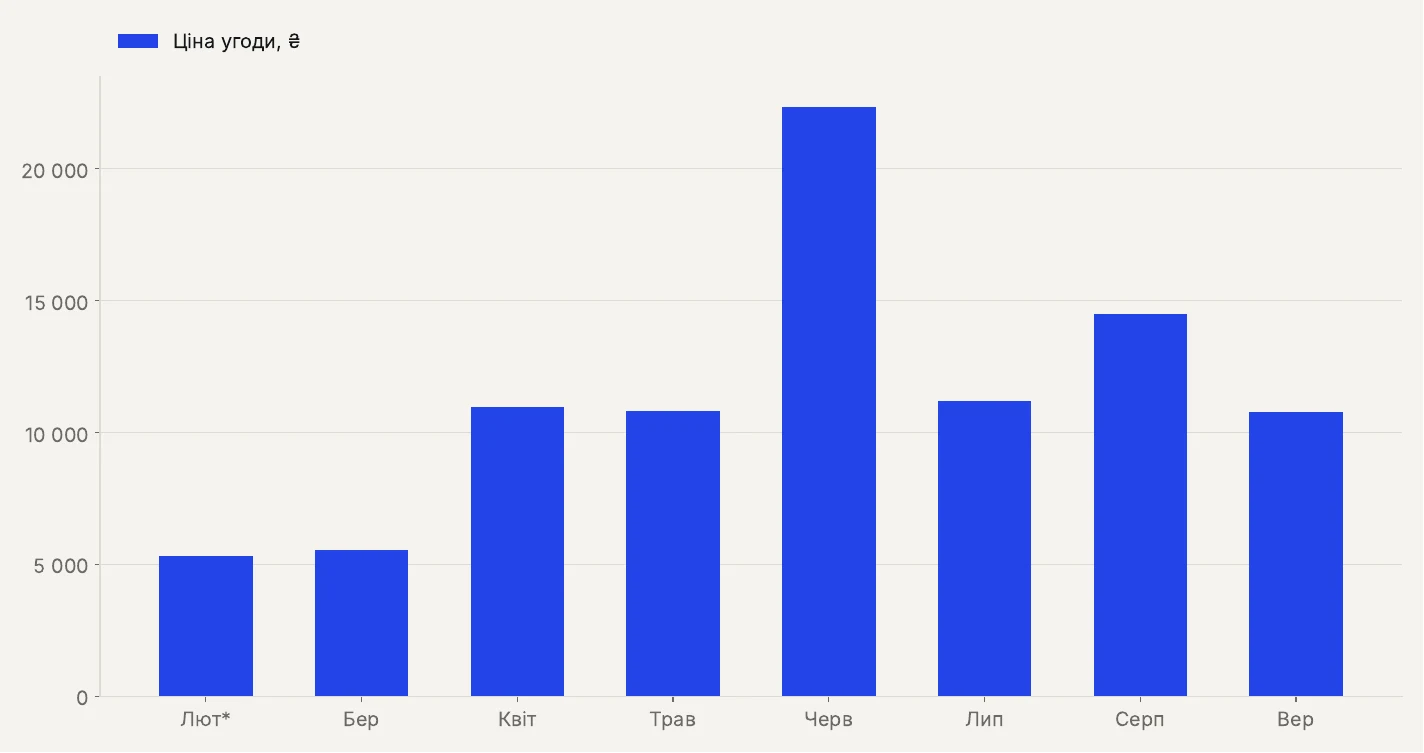
And here is an important point worth noting. A person who analyzes such a chart without context can make wrong decisions.
This metric shows the cost per deal not by the deal closing date, but by the date the lead entered the funnel. Honestly, without understanding this, the chart tells me nothing. If you overlay a second layer with the deal closing date, we might see some trend. Right now it is not informative, and I cannot draw substantive conclusions from it. Some conclusions can be drawn, but they will be based on guesses, not statistical data.
It is important to analyze not only the chart and the numbers. It is also important to take the context into account.
Qualified lead → deal
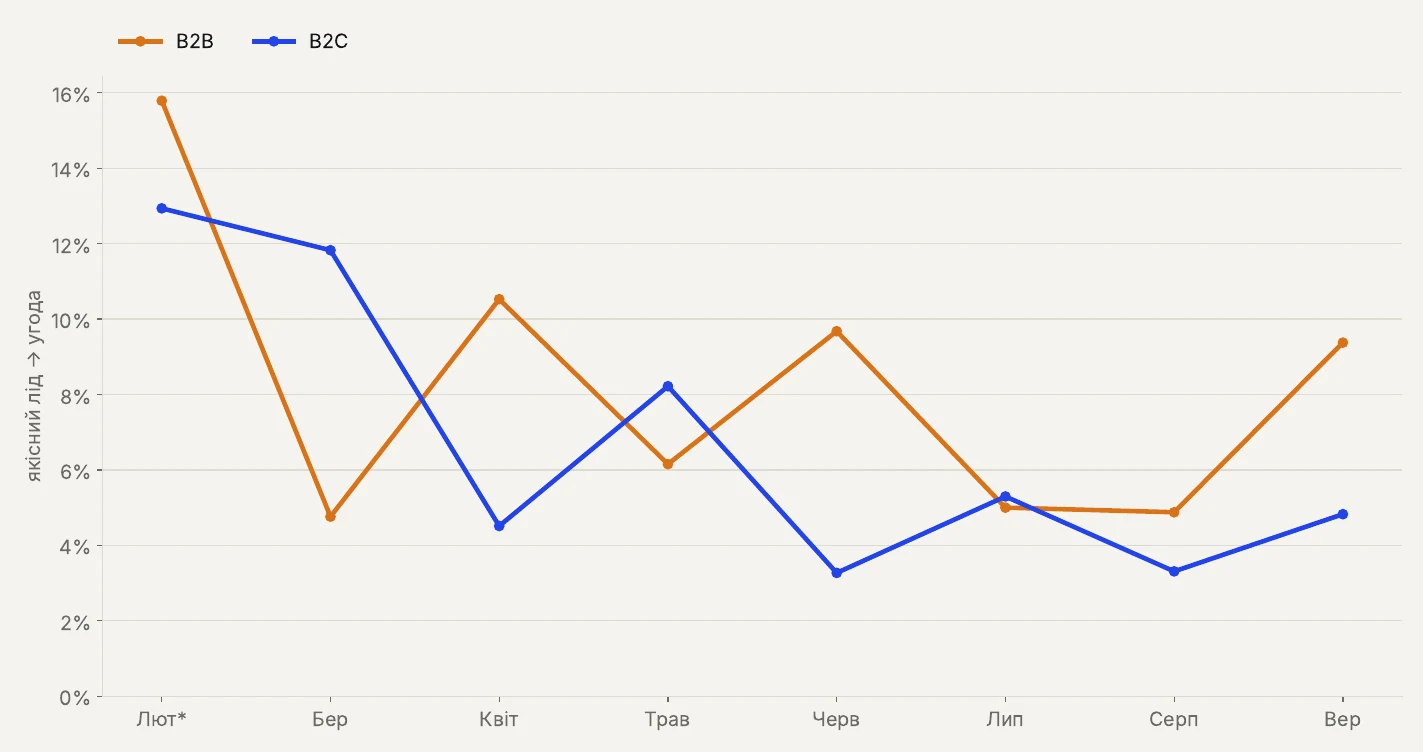
This chart again confirms my guess from the slide about junk by month. There is a very large spread in the ratio of qualified leads to deals.
When I see such chaos in statistical data — I do not know, maybe the managers go on vacation. You look at it and cannot say anything. I am taking an 8-month period here. What period would you need to see something statistically significant on this chart? In 10 years I will be retired, and by then I want to be doing other things.
This is a business that works with people and in which people work. I do not like the expression “human factor”: when people say that to me, it is as if they are shedding responsibility — “it’s not us, it depends on someone else”. But here it looks the way it looks.
Where B2B leads and deals come from
This slide is what the whole presentation was made for.
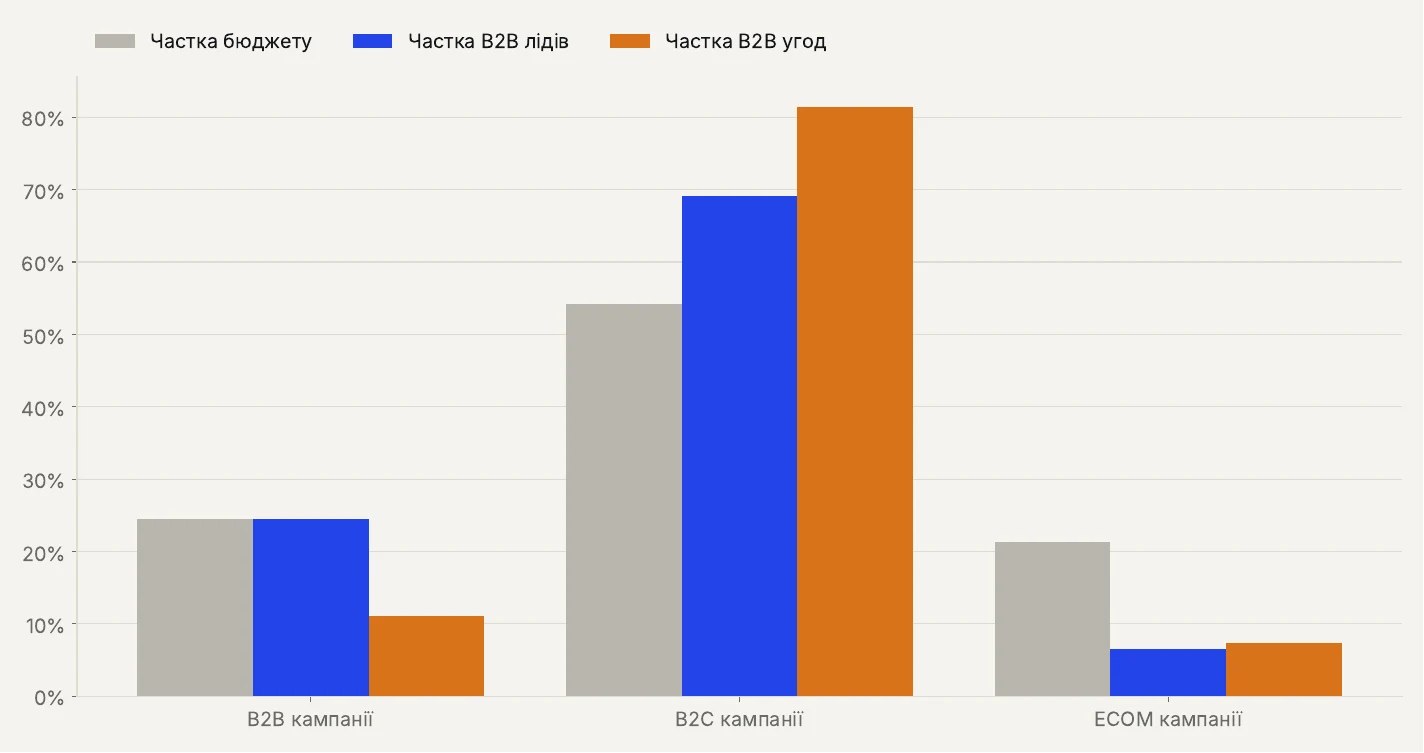
A bit of context. We have three groups of ad campaigns:
- B2B campaigns — with pure B2B messaging and B2B signals. Everything there is B2B, even the name has a B2B prefix, so Google Ads understands that we are looking only for B2B;
- B2C campaigns;
- ECOM campaigns — the online store. We do not touch it at all: at this stage it is not interesting to us for analysis, there is not enough data. We switch it on and off from time to time.
And now an interesting point. In B2B campaigns, the share of budget and the share of B2B leads are at the same level. And at the same time, B2B leads from B2B campaigns convert into deals very poorly.
Let’s look at B2C campaigns. The share of B2B leads there is significantly higher than in B2B campaigns. And this share closes into deals really well.
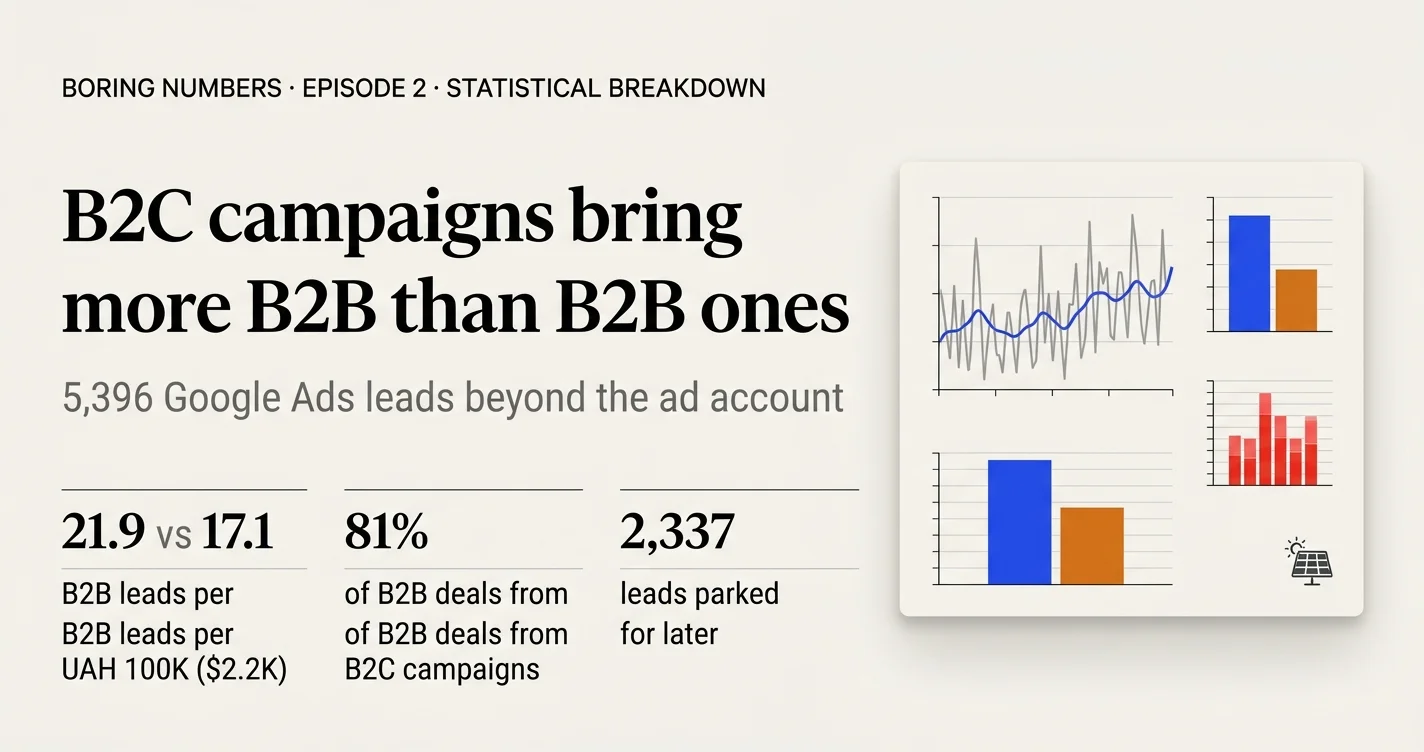
Such a paradox. I did everything to make B2B campaigns work as B2B campaigns. There were many different B2B campaigns — and they do not work for B2B. They bring B2C, no matter what I tell them to do. And B2C campaigns bring more B2B leads than B2B ones.
B2B leads per UAH 100,000
And here is the most important slide.
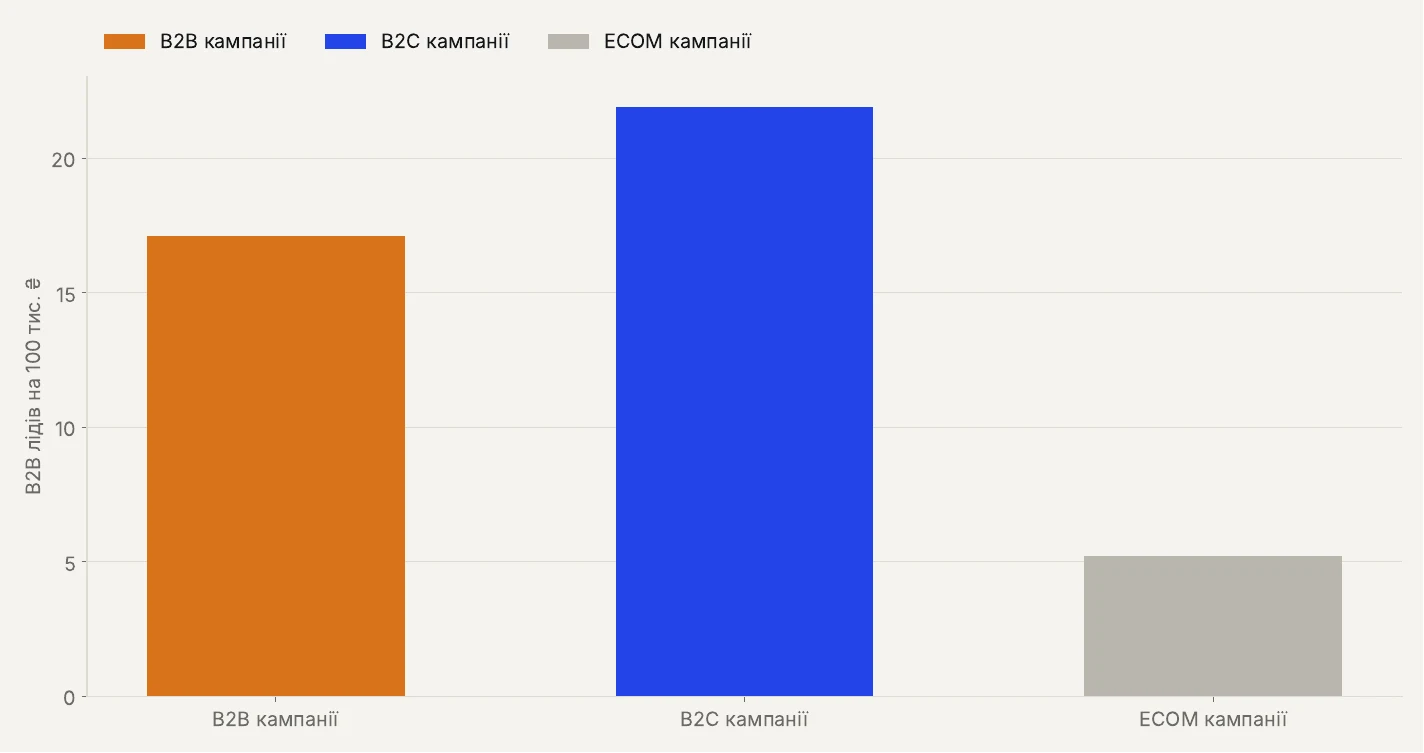
Splitting spend correctly between B2C and B2B campaigns is difficult. There is neither a methodology nor information in Google Ads that would make it possible to clearly determine the cost of a B2B lead. But there is relative data that I work with.
This slide shows: for every UAH 100,000 ($2.2K) of spend, B2B campaigns bring 17 B2B leads. And B2C campaigns — just “panels for the home” — bring 21.9 B2B leads.
This completely breaks the logic of decision-making. Ordinary B2C campaigns that say “we install plants for homes”, land on the “solar power plants for homes” page and use B2C audience signals, generate more B2B audience than B2B campaigns.
I have a hypothesis that looks like the truth: B2B campaigns lack signals. The signals from all ad campaigns include a B2B signal too. And B2C campaigns, thanks to a bigger budget and more leads, statistically generate more B2B leads than B2B campaigns that are short on signals. This is my main working hypothesis, and you have to live with it.
I used search campaigns, “solar plants for business”, and 100, 150, 200, 300, 500 kW. None of this converted into real B2B leads. But there is one type of campaign I will talk about next.
Which campaigns bring B2B leads
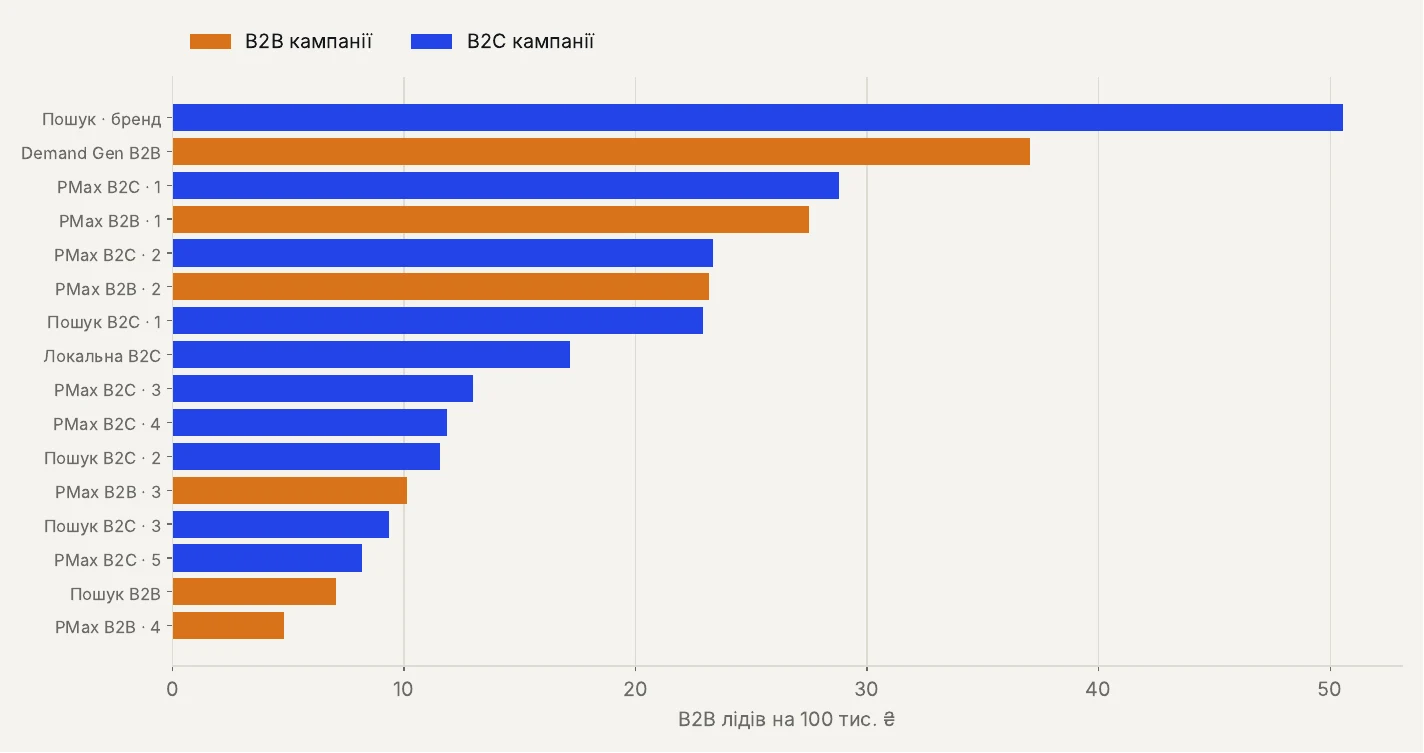
I take the first two — they are the most telling.
The first is the branded search campaign. It brings the most B2B leads. But that is not the merit of search ads. Its only merit is that it captures demand created by other channels, including search ads. People know the company — it does not matter how: through home or business solar plants. They know you, they trust you — and that is the most valuable traffic there can be.
To everyone who thinks there is no need to protect your own branded traffic because people will come to you anyway — hello. They may simply not reach you.
The second type of campaign I insisted on launching. I worked as a salesperson in the B2B segment and understand perfectly well how a B2B niche works. B2B is not B2C with a big order value. It is a completely different decision-making logic and a completely different deal cycle.
The logic here is this. I am told: “Launch more B2B campaigns so we attract more B2B audience.” But, as the previous slides show, this is a dead approach — specifically in this case.
From my experience working in B2B, I can confirm: a B2B audience does not sit and search for something on Google. A good B2B client is sought out; they do not search themselves. Small businesses that do not yet have connections and networking search. And large B2B clients — the fattest ones, with very large order values — will never in their lives look for you. If you do not knock on their doors and bring interesting offers, such as so-called retro bonuses, they will never contact you.
So I decided: if they do not search themselves, they need to be found elsewhere. And probably 3–4 months ago I launched a demand generation campaign specifically for B2B. It really converts the most into B2B leads — and at the lowest acquisition cost.
So we are not searching within hot demand. There is hot demand for large solar plants, but these clients will not look for you — your competitors are already looking for them. While you sit and pester Google Ads and your Google Ads contractor, competitors are already working with the fattest clients. Because they do not wait for leads to come in; they do lead generation themselves.
Third and fourth places are telling too: PMax B2C · 1 and PMax B2B · 1 run almost neck and neck — about 29 and 27.5 B2B leads per UAH 100K ($2.2K). So the best B2C campaign brings no fewer B2B leads than the best B2B one. This is one more confirmation of the signals hypothesis.
Conclusions
The most important and most interesting slide.
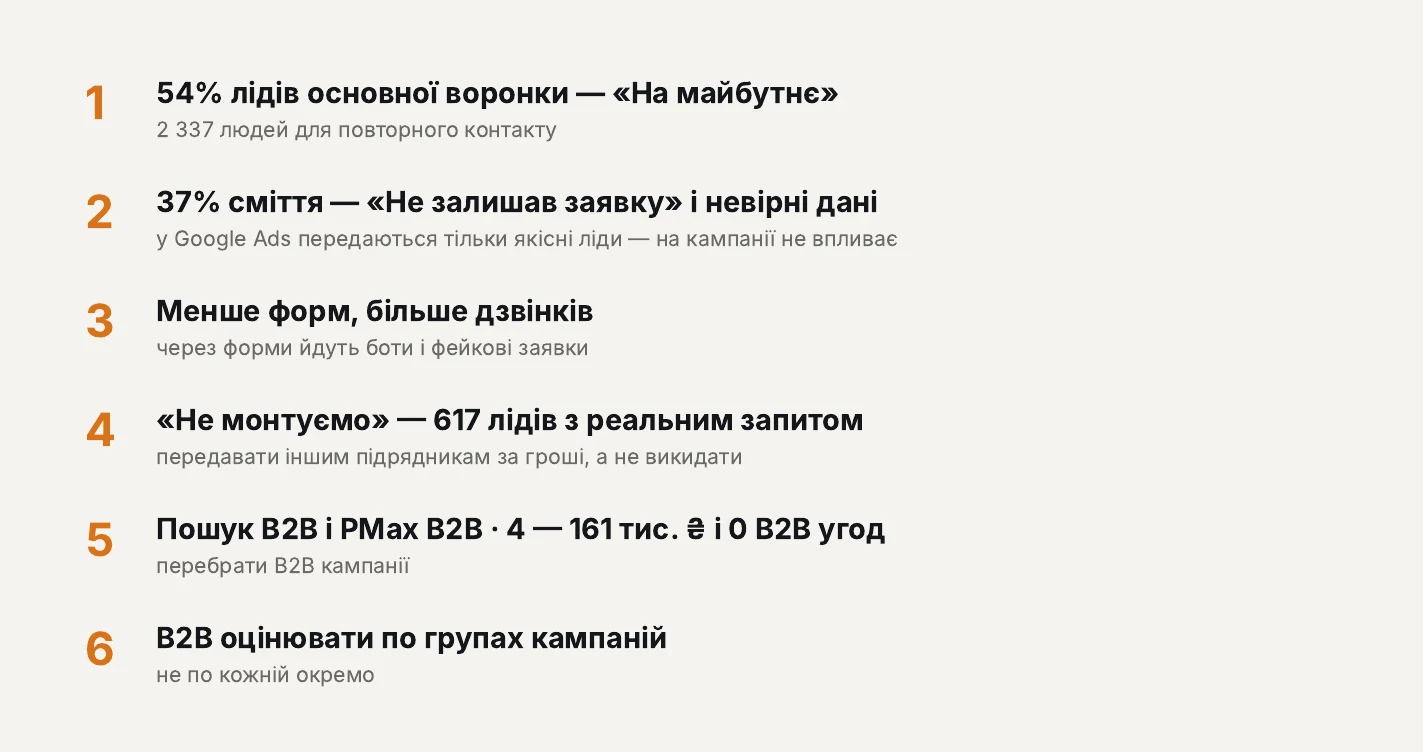
1. 54% of leads in the main funnel are in the “For later” status. That is 2,337 people set aside for a follow-up. I worked as a salesperson, and of course it is better to work with hot leads who are already ready. But the number of such people is limited. It is a small percentage: they come from branded traffic, already know you, trust you and say: “Guys, send the invoice, install it.” I have the same story: people who come from my YouTube hardly ask any questions. The only question is where to send the payment, I will pay now. Because they already know my approach to work and are already hot. That is great, but there are not many such people.
It is the same here. If we put 2,337 people on the back burner because they are still thinking, hesitating or unsure, we lose a lot. Any market is limited. While you put people in the black box “for later”, competitors will convert them. And when you come back to them because you have run out of hot ones, they will no longer need you.
2. 37% of junk is “Did not leave a request” and wrong details. This does not affect advertising, because such leads are not sent to Google Ads. Yes, managers call them and spend time, but I cannot influence this directly. Everything that can be cleaned up is cleaned up. But if a person deliberately leaves wrong or someone else’s details to troll someone, I cannot influence that. In this project there were cases when 10 requests came in within 10 minutes from one IP address with the same cookies. So one person clicked an ad and leaves a pile of requests. I cannot exclude them at the moment of the click.
3. Fewer forms, more calls. Bots and fake requests come through forms. In the previous case about dental equipment I showed: those who called bought in 90% of cases, and from the cart in 81%. It is the same in lead generation.
Sometimes I am even against forms in some niches. Forms bring mostly either small or not very high-quality requests. When a person calls by phone, they have a clear intent. They are not fooling around — they are calling with a question. Such people are hotter than those who leave requests in forms.
What could be done here? I do not recommend additional verification on forms — although we have not studied this question. You will want to exclude fake requests, but you will also exclude potential clients who will say: “Come on, phone number verification too? Let’s not” — and simply leave. Where possible, it is better to make the form shorter.
Another project is a private clinic in Dnipro. There, conversion from a call into a qualified lead is 73–80%, and from a form 30%. Even though it runs search campaigns and only one Performance Max spins somewhere miserably. This confirms once again: believe it or not, any sales manager will tell you that phone requests are higher quality than those from any form or lead form.
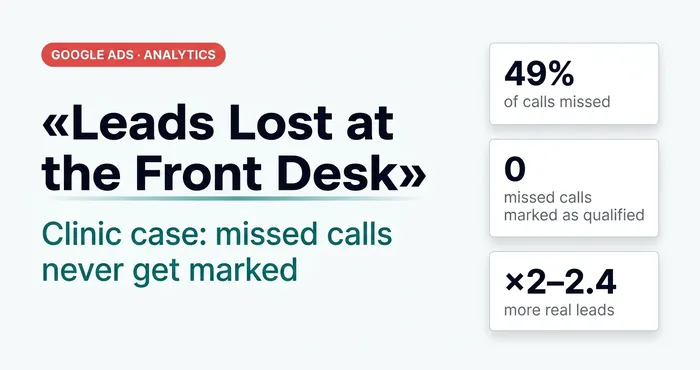 Analytics · Google AdsThree Months Treating the Ads. The Front Desk Was SickA clinic marks qualified calls in Binotel, but never the missed ones. Because of this, Google Ads sees half as many leads as there really are.
4. “We don’t install” and “We don’t install due to location” are not junk, but people with a real request. They can be passed to other contractors for money instead of being thrown away.
5. B2B search and PMax B2B · 4 — UAH 161K ($3.6K) and 0 B2B deals. This is a pool of campaigns, not one campaign, and it did not bring a single deal. I took a very long period, analyzed it and concluded that they simply need to be turned off. UAH 161K spent on one segment without a single deal — it is better to invest where there are deals. These campaigns have already been stopped.
6. B2B cannot really be evaluated by individual campaigns — only by groups. As this case shows, most B2B leads, and cheaper B2B leads, come from B2C campaigns, even if you count with very rough methods.
The overall conclusion: it is not that clear-cut. Such an analysis takes me a few hours — but only because it is my project and all the data for this analysis has already been collected. On an outside project it would definitely take much more time.
05 — CRMCRM integration with Google AdsOffline conversions: real sales from your CRM flow back into Google Ads, so the algorithm learns from revenue, not leads.
Where to find me
Message me on Telegram or by email — I respond quickly. Telegram channel and YouTube are for those who want to see real cases before reaching out and understand my approach.