
Marketer, analyst, ex-CMO focused on the Google ecosystem (Ads, Merchant Center, GA4, GTM). Google Partner. 150+ projects, 100+ positive reviews on Freelancehunt, 12+ countries.
- I work directly, with no account managers or subcontractors
- I measure results in sales, not in-platform conversions
- Maximum expertise in the Google ecosystem — instead of “PPC, social ads and SEO, all in one”
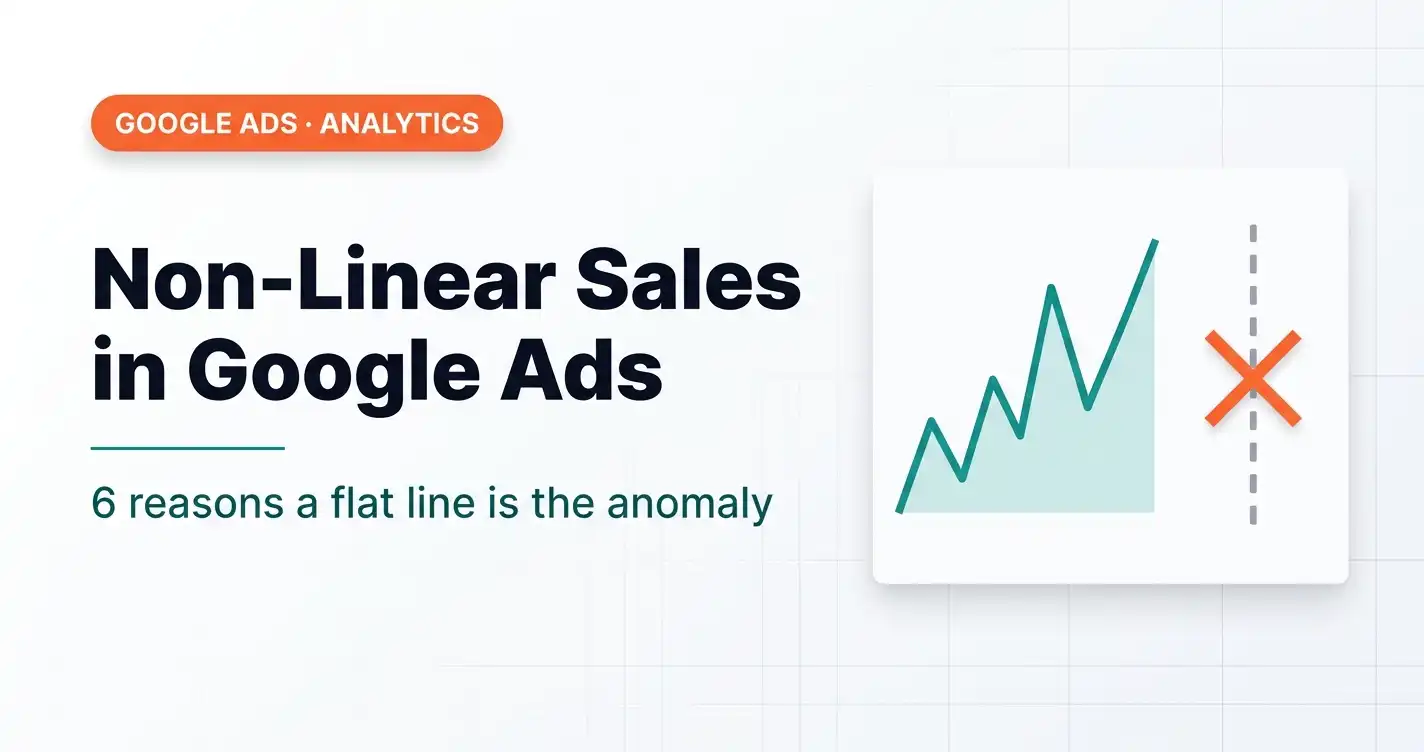
I get asked this on every other project. The client looks at the CRM, sees a sawtooth instead of a flat line — and concludes that “something broke.” I want to explain why this isn't a breakdown, but the normal physics of any business.
Contents
- 1. Any system with feedback oscillates rather than moving in a straight line
- 2. Resources at every level are finite
- 3. Inertia and delays — instant reactions almost never happen in business
- 4. Human behavior is cyclical by nature
- 5. The law of small numbers
- 6. The external environment is never static
- What Google Ads has to do with it specifically
- 4 real projects — the same sawtooth at different scales
- The main takeaway
- FAQ
How Google Ads Spreads Your Budget: Why Spend Differs from Day to Day

1. Any system with feedback oscillates rather than moving in a straight line
Sales aren't an independent variable. Demand affects supply, supply affects price, price affects demand. It's a closed loop. Systems like this almost never settle into a flat line — they swing around an equilibrium point, like a damped pendulum. This is a fundamental property of any dynamic system, not a quirk of your market or your ads.
2. Resources at every level are finite
The audience, the market, the buyer's budget — everything is limited. Any growth hits the ceiling of the current pool of people “ready to buy right now.” After that, the system waits for the pool to refill: new people arrive, someone gets a new income cycle, someone gets a new need. Hence the pattern: growth → plateau → pause → growth again.
3. Inertia and delays — instant reactions almost never happen in business
There's always a lag between cause and effect: a person learned about the product → thought it over → decided → bought. This delay blurs the signal. What you see as “a drop today” is often an echo of a decision made a week or a month ago. The ads you see now are “paying out” for decisions people made in the past.
4. Human behavior is cyclical by nature
People don't make decisions evenly over time — there are biorhythms (day/week), social rhythms (payday, holidays, seasons), emotional cycles (shopping fatigue, “revenge spending”). A business simply picks up these ripples of human behavior — they'd be there even if your ads didn't exist.
5. The law of small numbers
Over short time spans and small volumes, randomness looks like a trend. The brain looks for a pattern where there's really just a spread of values. The bigger the business and the longer the observation window, the more “linear” the same process looks, because random deviations are canceled out by the law of large numbers. 3 sales versus 10 is a dramatic difference in percentage terms, but statistically insignificant on small numbers.
6. The external environment is never static
Competitors, macroeconomics, weather, news, cultural shifts — they constantly change the rules of the game without your involvement. A business doesn't exist in a vacuum, but in an environment that pulses on its own.
What Google Ads has to do with it specifically
The Google Ads algorithm works inside this same system — it doesn't create nonlinearity, it inherits it. And it adds some of its own: the auction changes every hour (competitors adjust bids too), automated bidding strategies learn from statistics and “wander” on their own in search of the optimum, and audience reach depends on how many people are “ready to buy” right now.
4 real projects — the same sawtooth at different scales
Below are daily dynamics from four different projects: from a small budget to a large one, B2C and B2B, lead generation and e-commerce. The scale of the numbers differs, but the shape of the chart is the same sawtooth nonlinearity.
The main takeaway
Peaks and dips aren't a malfunction and aren't something to “fix.” They're the normal behavior of any complex adaptive system with limited resources, feedback delays and living people inside it. Linear growth is an unnatural state that happens only over very short stretches or as an averaging artifact: monthly reports look flatter than daily ones precisely because the small fluctuations within the month cancel each other out.
Next time a client asks “why was it 3 yesterday and 10 today” — you'll have something to say besides “that's just how it is.”
What non-linearity looks like in real numbers — 214 days, 2,879 sales and a daily ROAS from 0.16 to 83 — in the breakdown “Boring Numbers | Episode 1”.
Where to find me
Message me on Telegram or by email — I respond quickly. Telegram channel and YouTube are for those who want to see real cases before reaching out and understand my approach.