
Marketer, analyst, ex-CMO focused on the Google ecosystem (Ads, Merchant Center, GA4, GTM). Google Partner. 150+ projects, 100+ positive reviews on Freelancehunt, 12+ countries.
- I work directly, with no account managers or subcontractors
- I measure results in sales, not in-platform conversions
- Maximum expertise in the Google ecosystem — instead of “PPC, social ads and SEO, all in one”
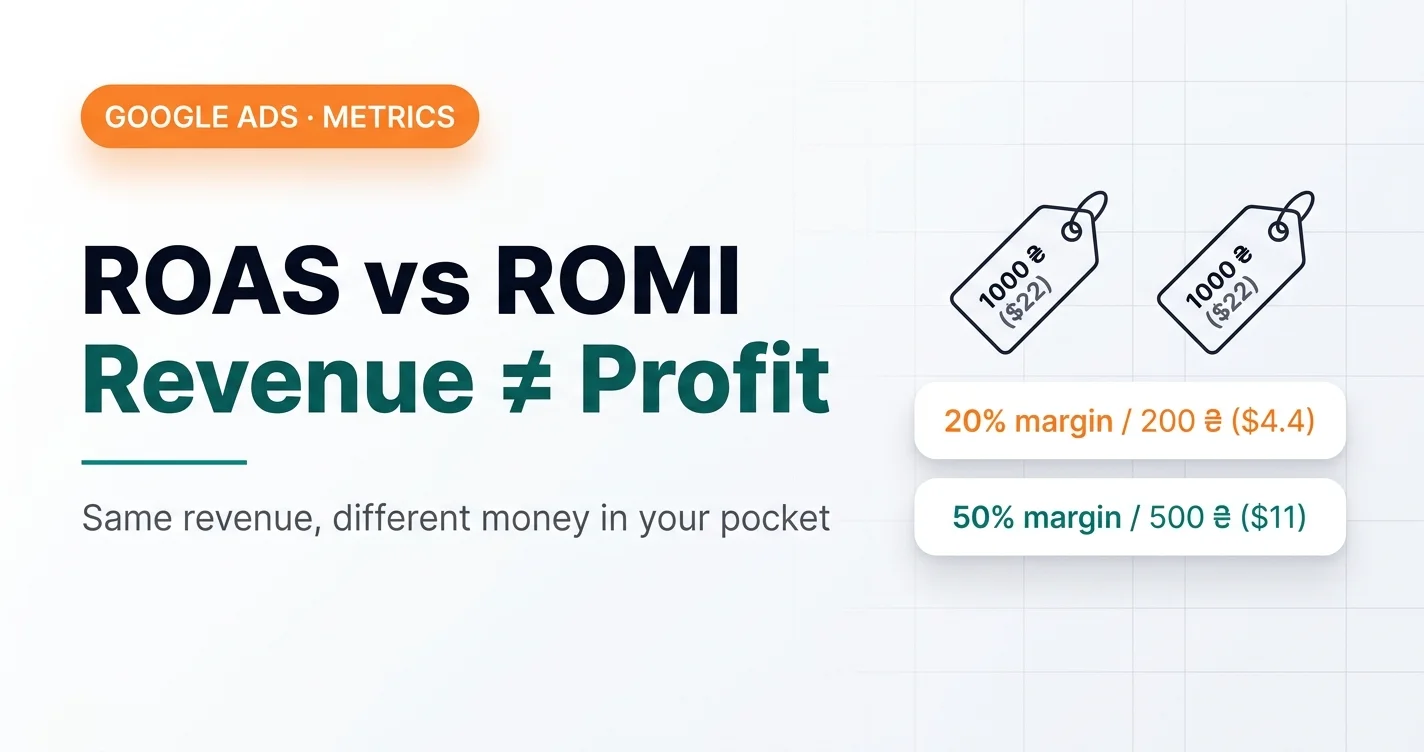
I’ll explain why your ROAS in the ad account can look great while the money is zero. Using a concrete example from a real project.

Contents
Look at what happens in practice
There are five campaigns. Look at three of them, with very similar ROAS: 11.38x, 11.15x, 11.42x. Seems like they’re all about the same. But now look at ROMI based on margin:
| Spend | Orders | Revenue | Margin | ROAS | ROMI |
|---|---|---|---|---|---|
| 29 418 ₴ | 240 | 220 108 ₴ | 47 126 ₴ | 7.48x | 60.2% |
| 13 899 ₴ | 43 | 158 158 ₴ | 26 235 ₴ | 11.38x | 88.8% |
| 13 285 ₴ | 119 | 148 095 ₴ | 34 704 ₴ | 11.15x | 161.2% |
| 8 835 ₴ | 29 | 100 900 ₴ | 15 745 ₴ | 11.42x | 78.2% |
| 5 147 ₴ | 15 | 22 632 ₴ | 6 835 ₴ | 4.40x | 32.8% |
| 70 583 ₴ | 446 | 649 893 ₴ | 130 645 ₴ | 9.21x | 85.1% |
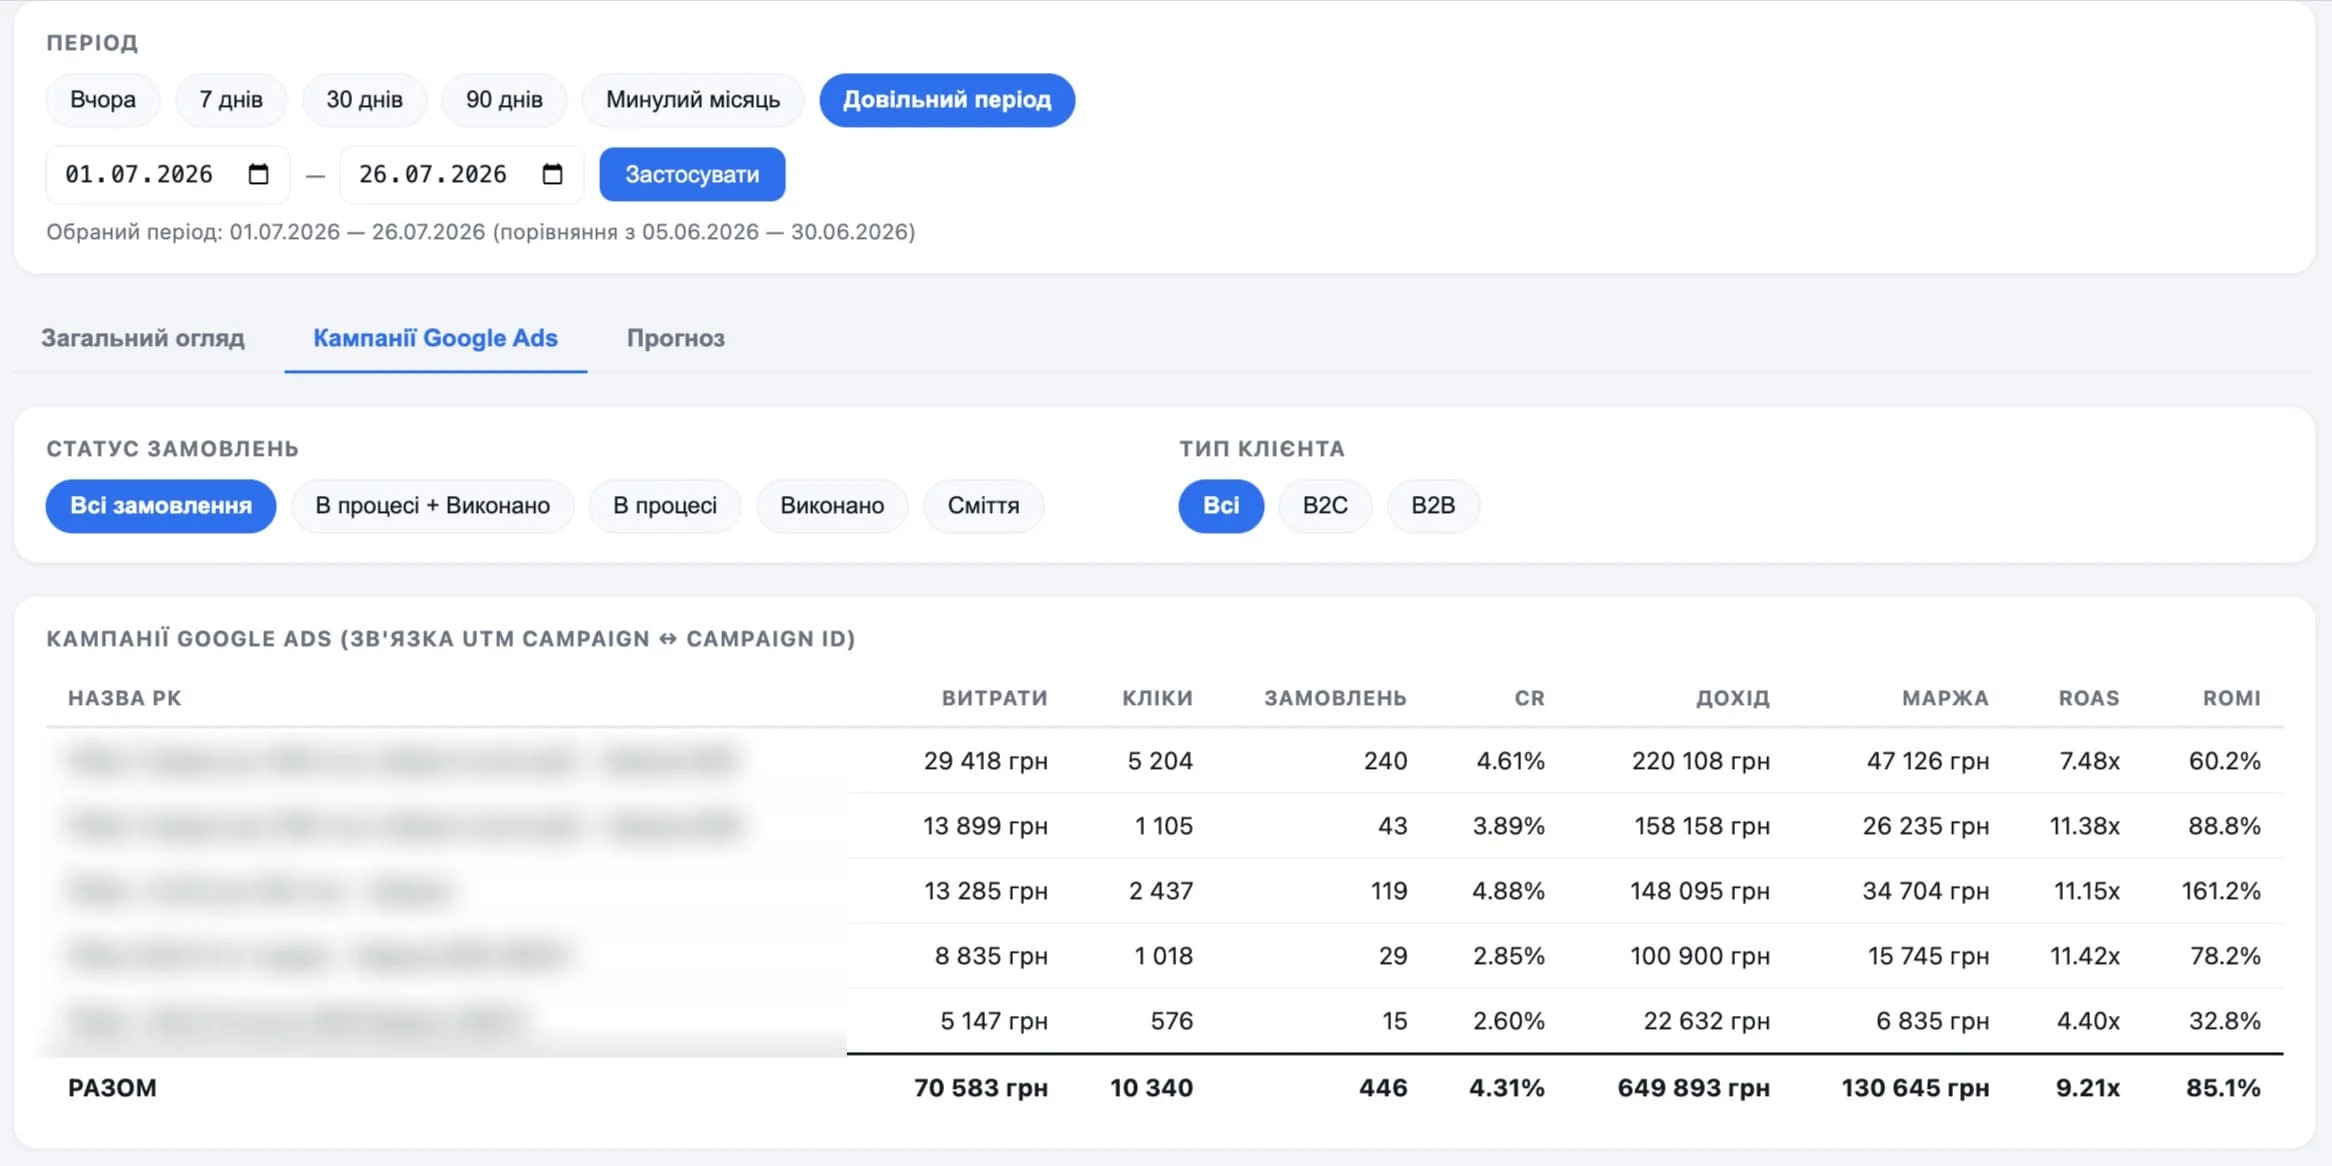
Three campaigns with practically the same ROAS: 11.15x, 11.38x, 11.42x. And their ROMI: 161.2%, 88.8% and 78.2%. A twofold difference. With the same ROAS.
And the other way around: the campaign with the most orders (240) and the highest spend (29,418 UAH, $654) has a ROAS of 7.48x and a ROMI of just 60.2%. Meanwhile the campaign with 13,285 UAH ($295) in spend and 119 orders has a ROAS of 11.15x and a ROMI of 161.2%.
Why this happens
ROAS means optimizing ads for revenue. Gross revenue, at that: no cost of goods, no margin, no returns. Google sees that 1 UAH spent brought in 11 UAH of revenue and considers the campaign effective.
ROMI means optimizing for gross profit. It’s much closer to real net profit than ROAS. And it’s what shows whether you’re actually making money.
Different products have different margins. A campaign can generate big revenue on cheap, low-margin products, and ROAS will look decent. But the real profit is pennies.
What most contractors do
They keep optimizing ads for ROAS. They try to push it up with bidding strategies, constraints, Target ROAS. And they scale whatever shows the best ROAS in the account.
As a result, they scale a campaign that doesn’t deliver the best margin and underrate, or don’t scale at all, the one that actually brings in money. Because they don’t work with real margin-based payback metrics; they simply can’t see them.
In the example above: if the contractor looked only at ROAS, he’d scale the campaigns at 11.38x and 11.42x and ignore the one at 11.15x, which is actually the most profitable (ROMI 161.2%). The difference in ROAS is tiny. The difference in real results is twofold.
What to do about it
Connect end-to-end analytics that sends real margin data from your CRM to Google Ads, and optimize for ROMI, not ROAS. Then the algorithm looks not for customers with big orders, but for those who bring real profit.
That’s the key difference between “the ads look good in the account” and “the ads actually make money”.
For how ROAS, CPS and real CRM orders look in a monthly client report, I walk through an example in “Google Ads Reporting from an Expert”.
How a high ROAS hides loss-making orders, I showed on 2,879 sales: a third of baskets do not even cover the ad cost — in the breakdown “Boring Numbers | Episode 1”.
Why channels should be compared by cost per deal rather than by leads — in “Google Ads, SEO, Meta or TikTok: Which Brings Sales”.
You can calculate ROAS and break-even ROAS for your store with the free ROAS calculator.
Where to find me
Message me on Telegram or by email — I respond quickly. Telegram channel and YouTube are for those who want to see real cases before reaching out and understand my approach.