
Marketer, analyst, ex-CMO focused on the Google ecosystem (Ads, Merchant Center, GA4, GTM). Google Partner. 150+ projects, 100+ positive reviews on Freelancehunt, 12+ countries.
- I work directly, with no account managers or subcontractors
- I measure results in sales, not in-platform conversions
- Maximum expertise in the Google ecosystem
Recently, a request came in on Freelancehunt from an online store selling mobile accessories. Performance Max results had been declining for two months, and the client asked for an analysis of ROAS, CPA, average order value and cost per conversion. Further down the same text, he wrote that what really mattered to him was not lowering the cost per sale or increasing ROAS, but increasing the actual profitability of advertising.
In other words, the person asks you to break down one metric while complaining about a completely different one. And this isn’t one client’s mistake — most business owners I work with think this way. So let me lay ROAS out piece by piece: what it shows, how to calculate it and what it will never tell you.
Contents
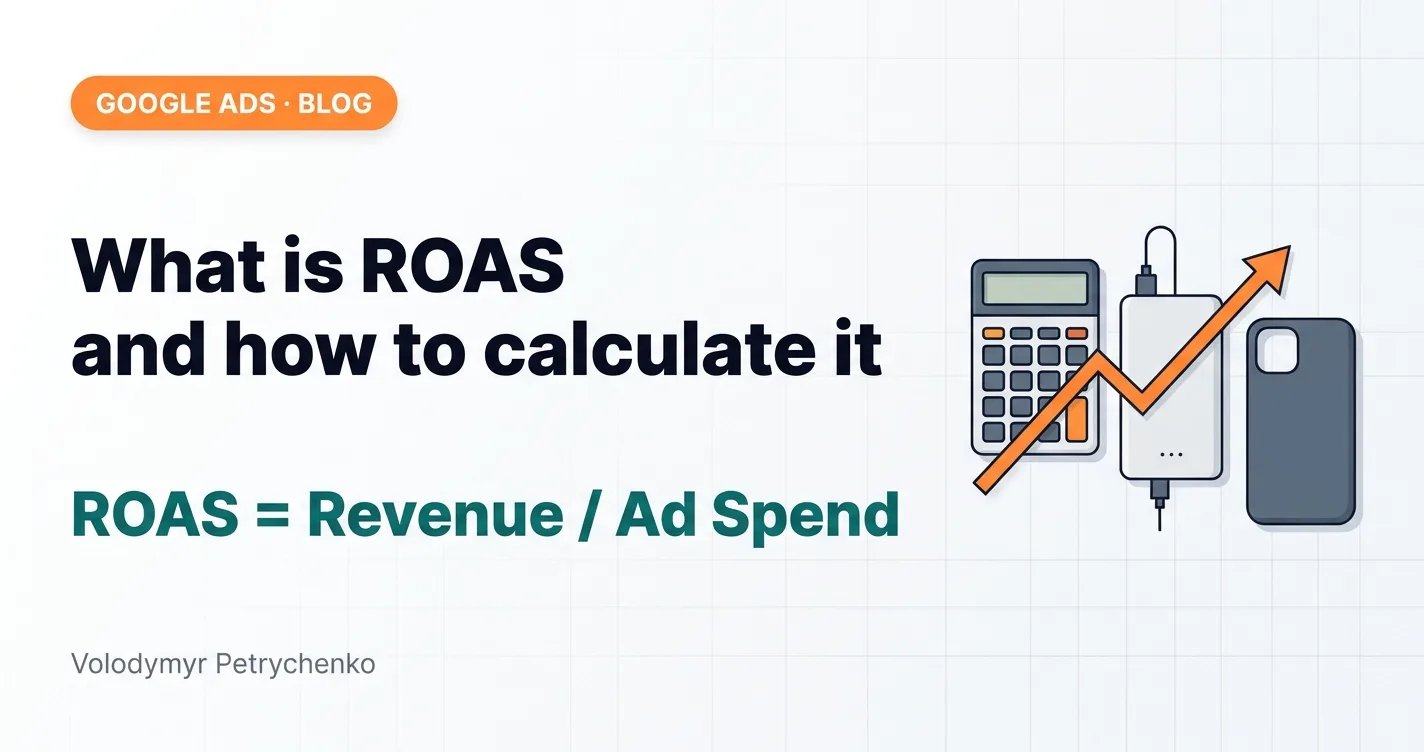
What ROAS is in plain words
ROAS (Return On Ad Spend) is how much revenue each unit of currency spent on advertising brought in. Not profit — revenue, meaning the total value of orders.
There’s one formula:
ROAS = Revenue from ads / Ad spend
You spent UAH 10,000 ($222) on Google Ads and got orders worth UAH 50,000 ($1,111) — ROAS = 5. The same can be written as a percentage: 500%. In the campaign table Google Ads shows ROAS as a number (5), while in the bid strategy settings target ROAS is set as a percentage (500%). It’s the same thing — don’t mix them up.
How to calculate ROAS: three examples
| Spend | Revenue | ROAS |
|---|---|---|
| UAH 10,000 ($222) | UAH 50,000 ($1,111) | 5 (500%) |
| UAH 10,000 ($222) | UAH 20,000 ($444) | 2 (200%) |
| UAH 10,000 ($222) | UAH 8,000 ($178) | 0,8 (80%) |
The first row looks great, the last one is clearly bad. But whether the second is good, you can’t tell from the numbers. And this is where it gets interesting.
What ROAS counts as normal
The most popular question I get is “so what ROAS is normal?”. The right answer: it depends on your margin. Margin is what’s left of the product price after the purchase cost. Sold for UAH 1,000 ($22), bought for UAH 700 ($16) — the margin is UAH 300 ($7), or 30%.
From this you calculate break-even ROAS — the minimum ROAS at which advertising at least doesn’t eat up all your earnings:
Break-even ROAS = 1 / margin
| Margin | Break-even ROAS |
|---|---|
| 50% | 2 (200%) |
| 30% | 3,33 (333%) |
| 20% | 5 (500%) |
| 10% | 10 (1000%) |
So a ROAS of 500% for a store with a 50% margin is good money, while for a store with a 20% margin it’s zero. You just cycled money through Google and earned nothing. That’s why when someone at a conference brags about “ROAS 700%”, it means nothing to me until they name the margin.
And that’s before salaries, shipping, returns and everything else. The real break-even point is always higher.
ROAS calculator
Enter your ad spend and revenue — the calculator will show ROAS. Add your margin to see break-even ROAS and how much you actually earned after paying for ads.
ROAS calculator
Enter your ad spend and revenue. Add your margin to see whether your ads actually make money.
Add your margin to see whether you make money on ads
For a full payback calculation with e-commerce and lead generation modes, use the Google Ads ROI calculator.
Why a high ROAS doesn’t mean profit
Back to the accessories store. Here’s the request itself:
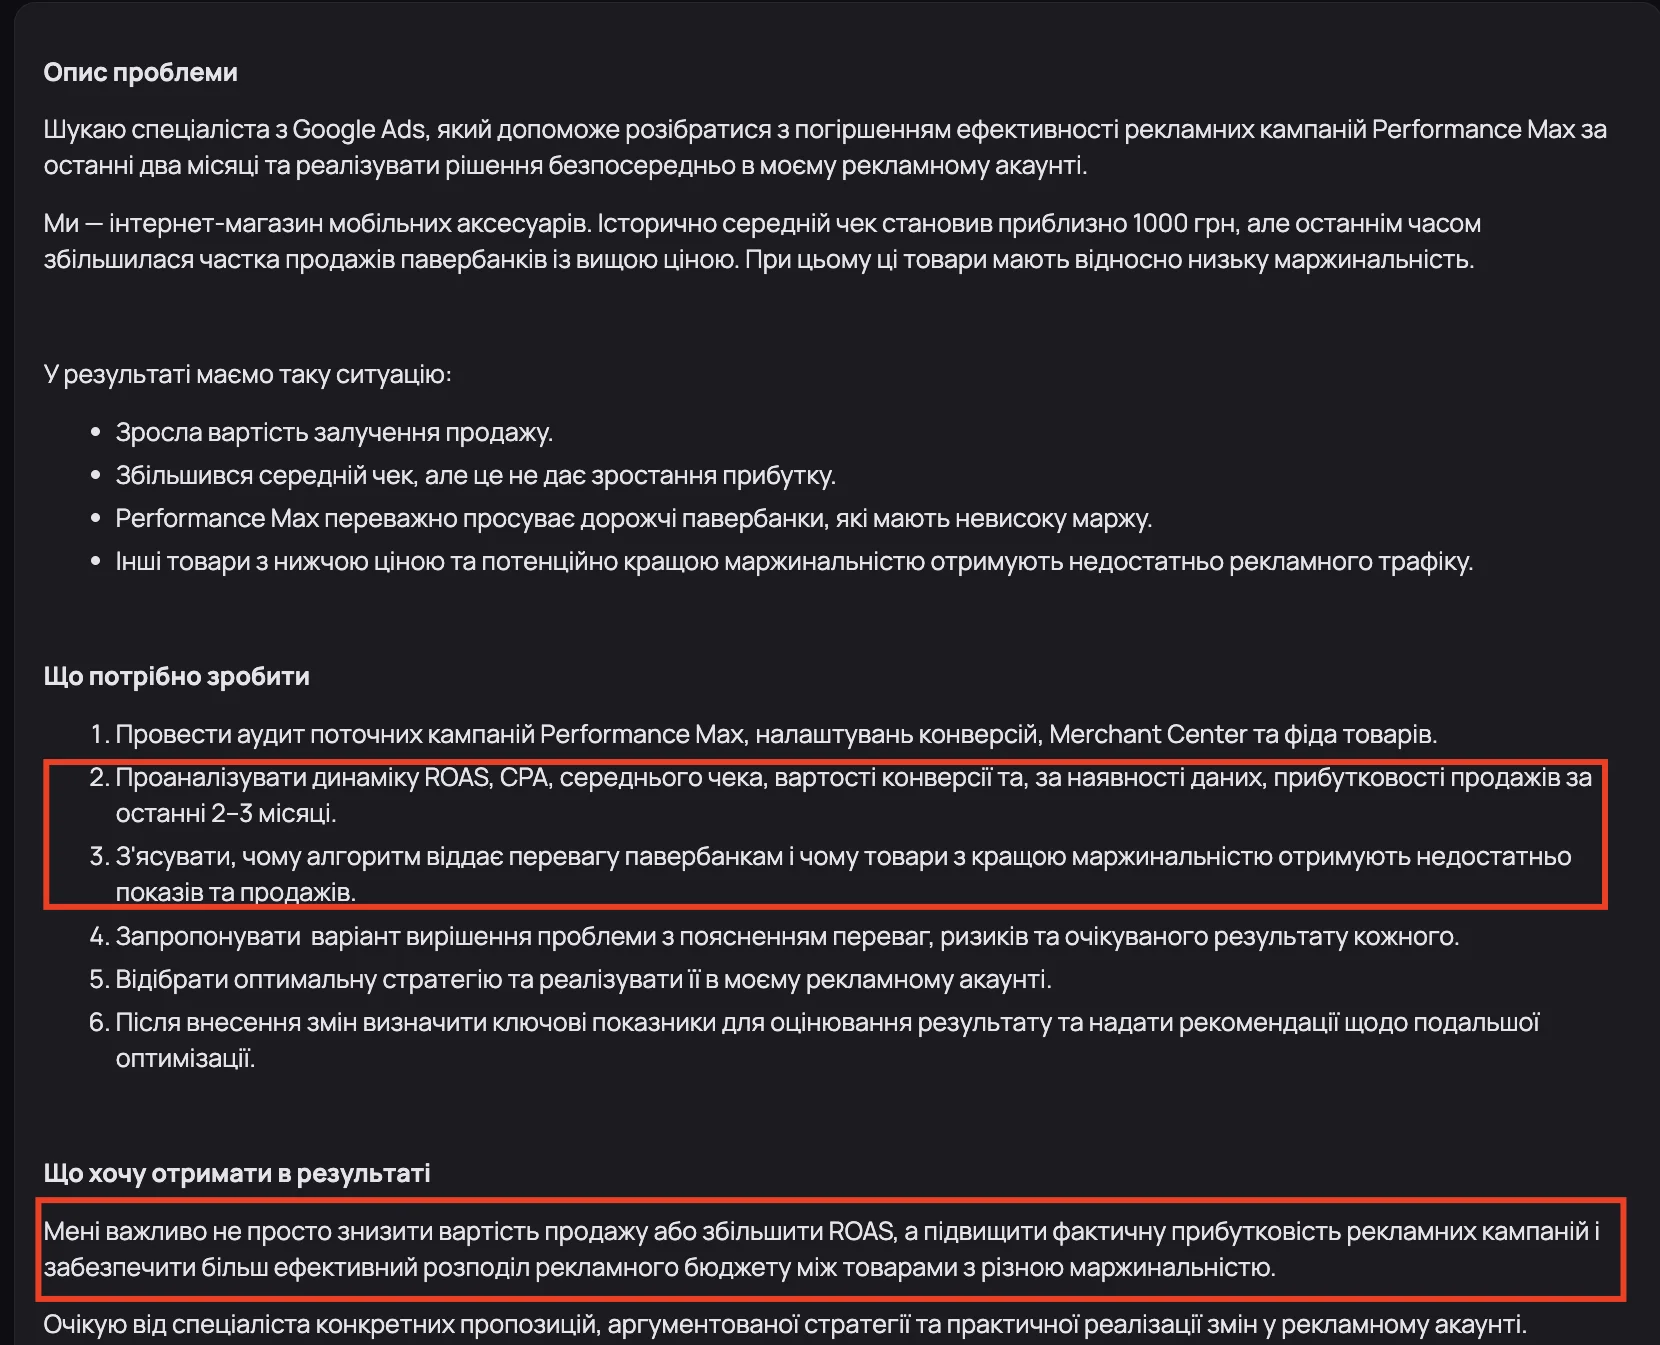
Look at the two highlighted parts. In points 2 and 3 the client asks to analyze ROAS, CPA, average order value and cost per conversion. But as a result he wants something completely different: not a higher ROAS, but higher profitability and a better budget split between products with different margins. It’s good that he understands this himself. It’s bad that ROAS won’t help here at all.
Historically their average order was around UAH 1,000 ($22). Then the share of expensive, low-margin power banks grew. The average order went up, cost per sale went up, and profit stayed flat.
Here’s what’s happening, with illustrative numbers:
| Case + screen protector | Power bank | |
|---|---|---|
| Price | UAH 1,000 ($22) | UAH 2,500 ($56) |
| Margin | 40% (UAH 400 / $9) | 12% (UAH 300 / $7) |
| Ad cost per sale | UAH 200 ($4) | UAH 200 ($4) |
| ROAS | 5 (500%) | 12,5 (1250%) |
| Left after ad spend | UAH 200 ($4) | UAH 100 ($2) |
For Google the power bank is a star: ROAS is 2.5 times higher. For the owner it’s half the money from each sale. And Performance Max, optimizing for revenue, quite logically chases power banks — because that’s exactly what it was asked to do.
I replied to the request briefly:

If Google Ads only receives revenue, it can’t guess which product is more profitable for you. The algorithm only sees the order value you passed to it, and maximizes exactly that. You can’t fix this with buttons in the account: not with target ROAS, not by excluding products, not with new campaigns.
There’s one solution — send Google Ads not revenue but the gross profit of each order, and optimize advertising on it. It can be done with a CRM or without one — that affects the cost, but the principle is the same. I described how it works for small stores without a CRM on the page offline conversions without a CRM.
05 — CRMCRM integration with Google AdsOffline conversions: real sales from your CRM flow back into Google Ads, so the algorithm learns from revenue, not leads.Where to find ROAS in Google Ads
There’s no column called “ROAS” in the account. It’s called “Conv. value / cost”. If it isn’t in the table, click “Columns” above the campaign table:
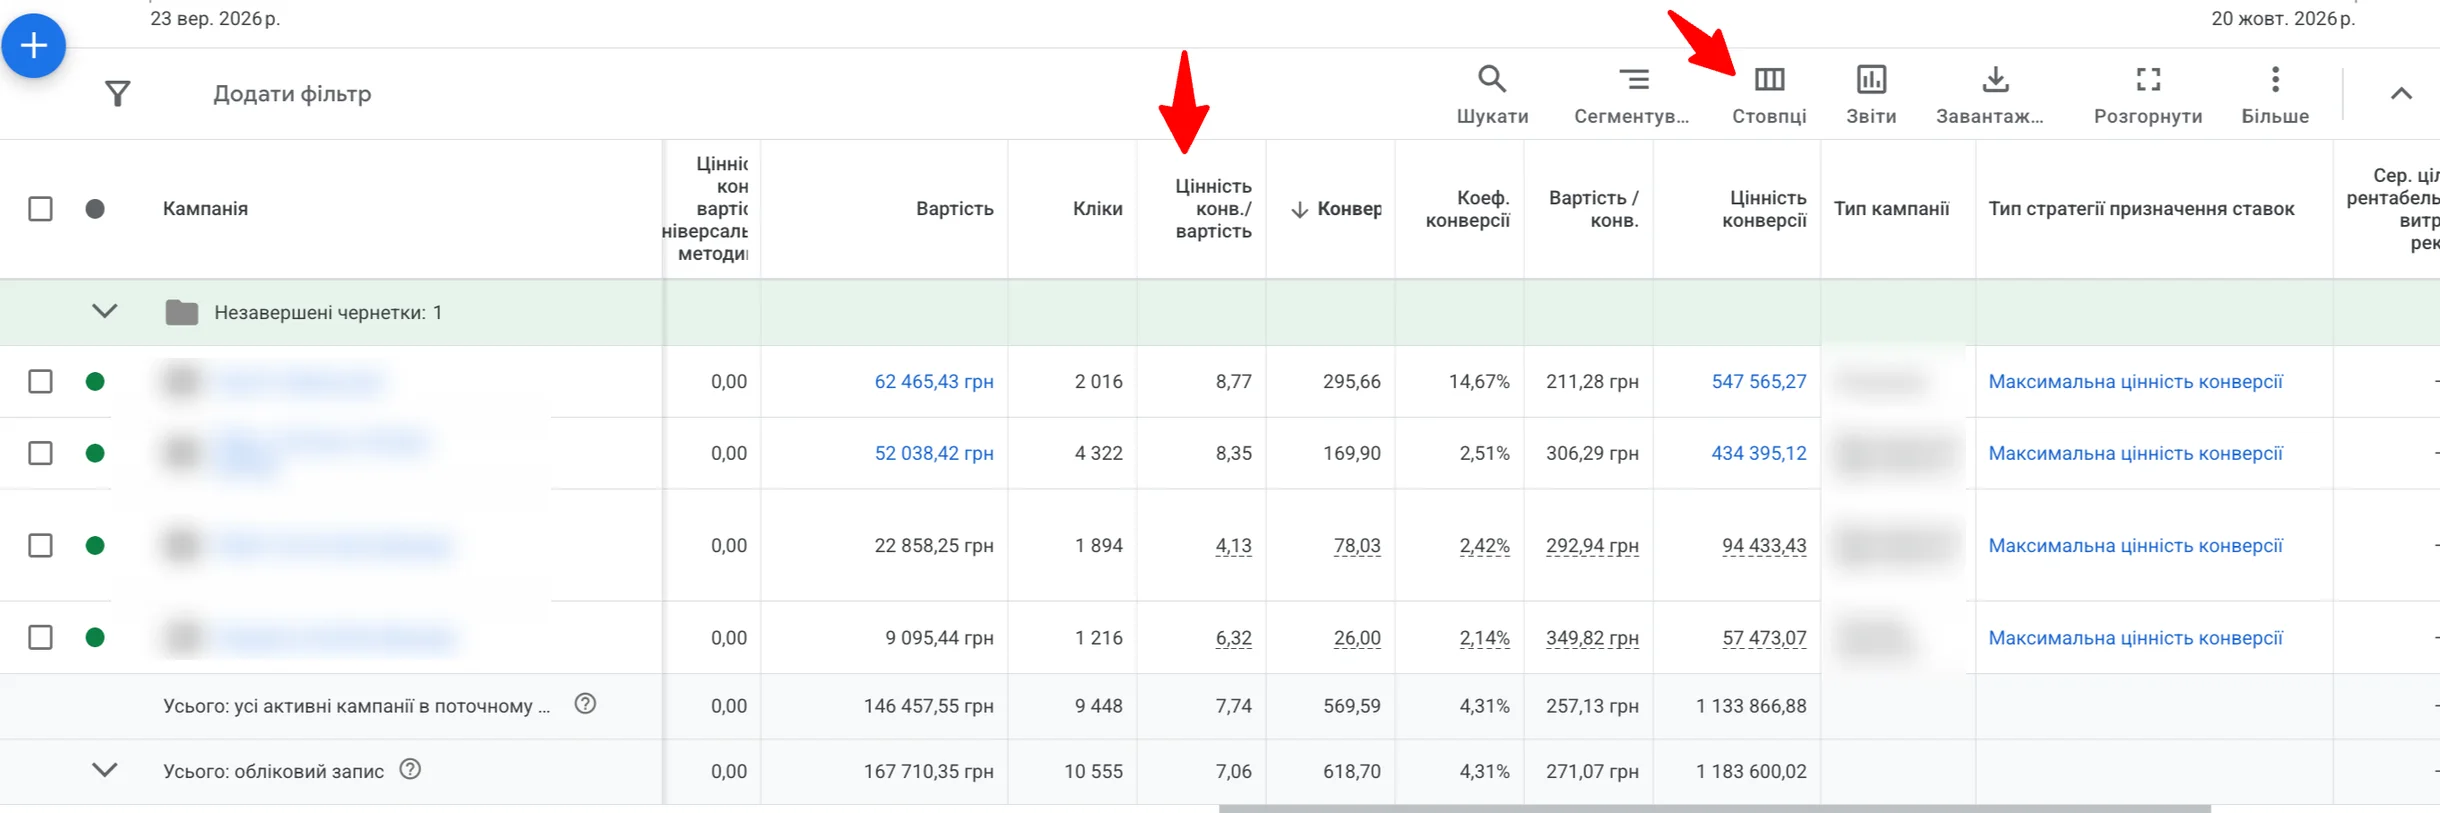
The screenshot shows a real online store account for a month: spend UAH 146,457 ($3,255), conversion value UAH 1,133,867 ($25,197), ROAS 7.74. That’s the same as 774%. The campaigns run on the “Maximize conversion value” strategy — meaning the algorithm chases revenue.
Then “Modify columns” → the “Conversions” section → tick “Conv. value / cost” and click “Apply”:
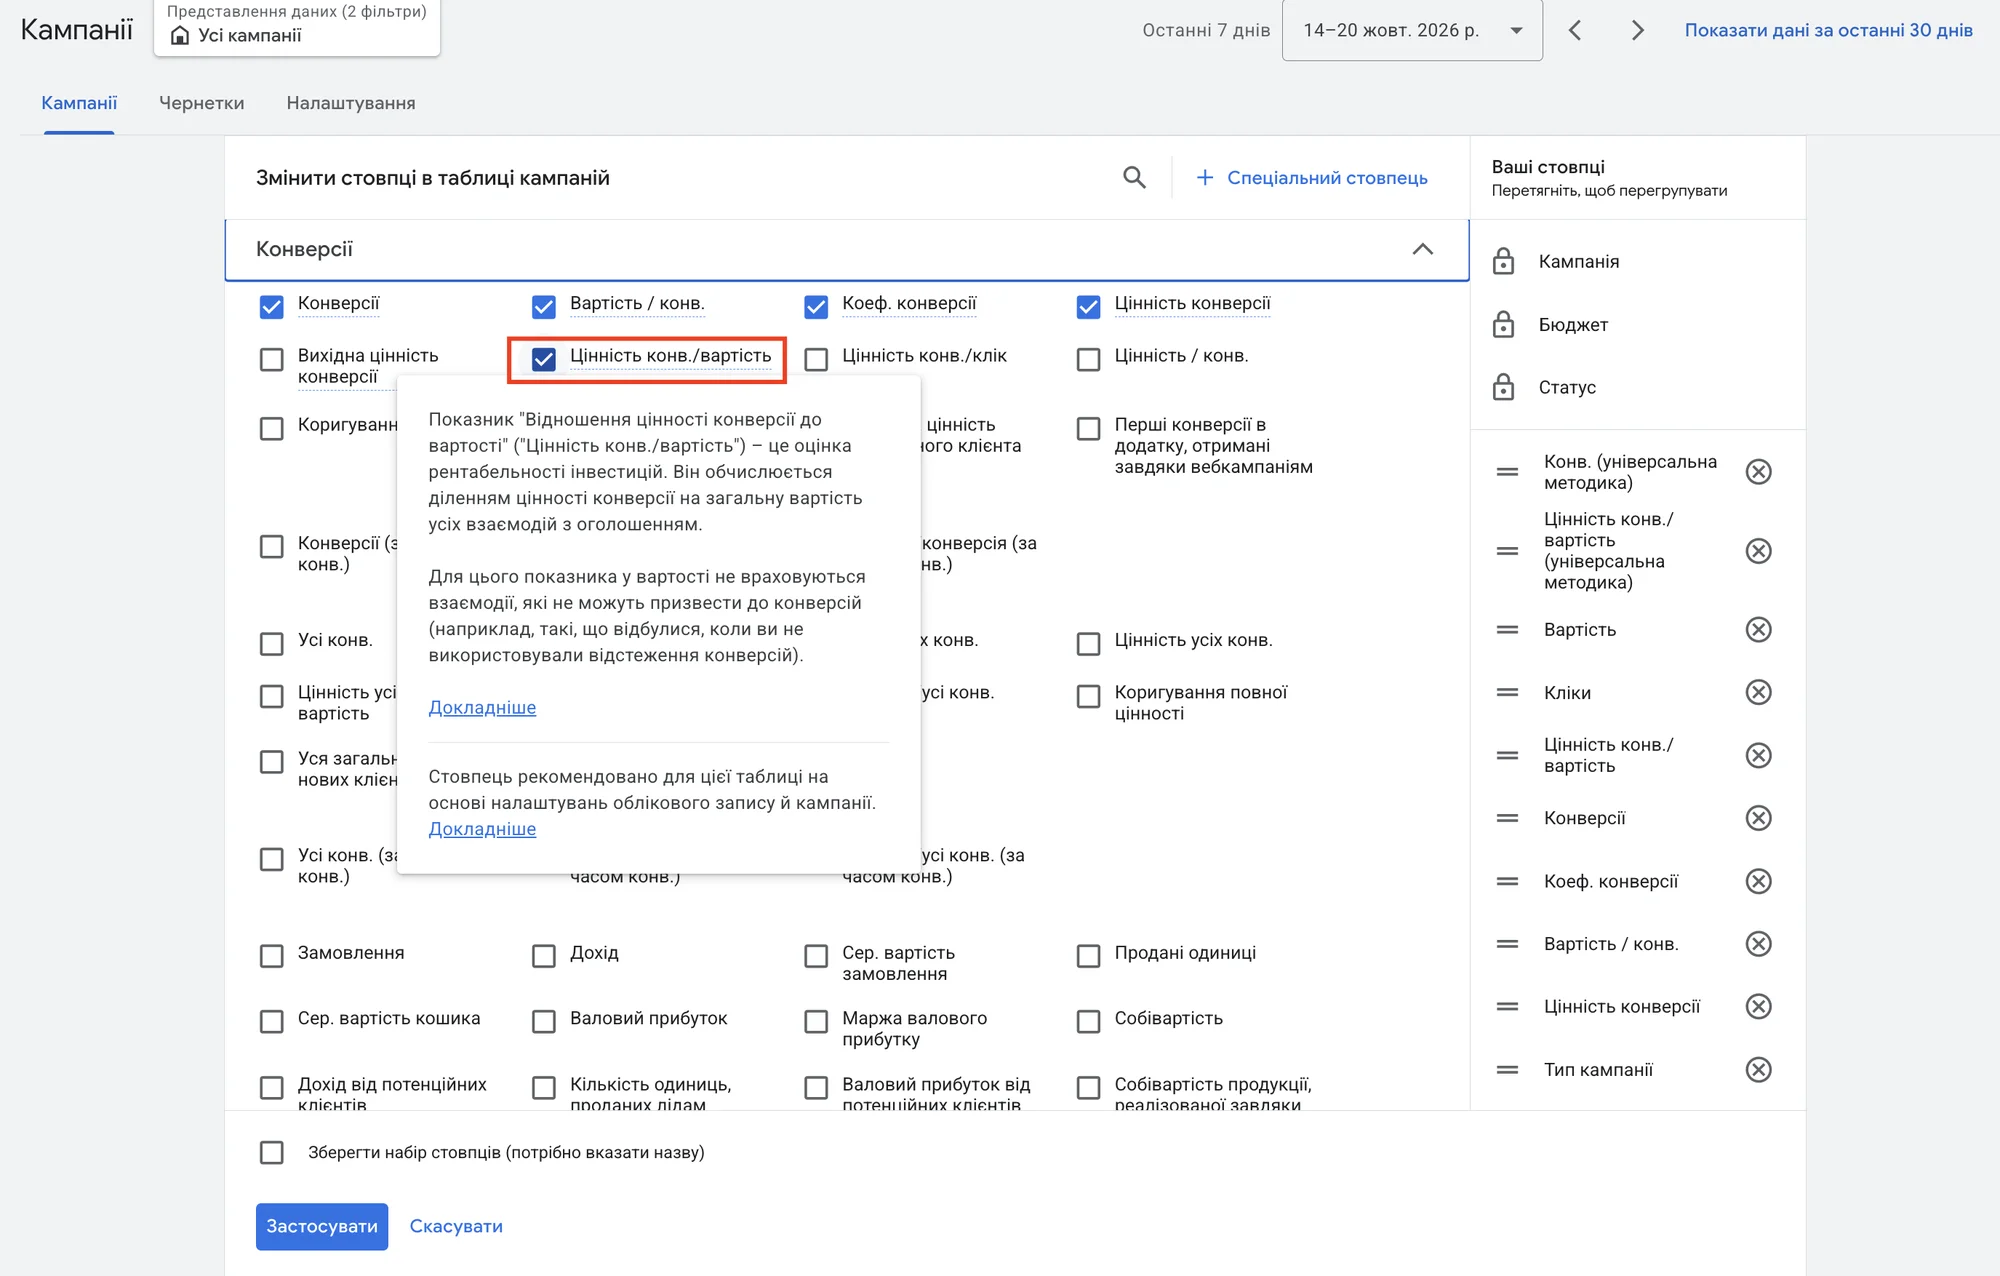
And most importantly: the “Conv. value / cost” column will be empty or misleading if conversions don’t pass the order value. Before drawing any conclusions, check that purchase tracking is set up and passes real amounts, not “1” per conversion.
Why in-account ROAS doesn’t match reality
Even when everything is set up, ROAS in Google Ads almost always differs from what you see in your CRM. The reasons:
- cancelled orders and returns: in the account they remain “sales”;
- attribution: Google credits itself with orders where it was just one of the steps;
- calls and messengers: these sales, on the contrary, often never reach the account at all;
- short periods: ROAS for a day or a week jumps around so much that you can’t draw conclusions from it. I broke this down with numbers in “Boring Numbers”.
So in-account ROAS is a guide for the algorithm, not a report for the owner.
ROAS vs ROMI — what’s the difference
ROAS measures revenue, ROMI measures profit after ad spend:
High ROAS, but No Money? The Key Difference Between ROAS and ROMI in Google Ads

ROMI = (Gross profit − Ad spend) / Ad spend
It’s ROMI that answers the question “am I making money on ads or not”. In the power bank example ROAS is 1250%, while ROMI is only 50%. I wrote about the difference separately in the article ROAS vs ROMI.
Conclusion
ROAS is a useful metric, but it measures turnover, not earnings. It’s good for steering the algorithm and comparing campaigns with each other. It can’t answer the question “is my business making money on advertising”.
If, like that accessories store, your ROAS is growing but there’s no more money — the problem isn’t in the campaign settings. Google is simply optimizing for something other than what you need.
03 — AuditGoogle Ads account auditI find where the budget leaks: structure, bidding, keywords, conversion tracking, website.The ROAS calculator is also available as a standalone page, without the article: ROAS calculator. My other free tools are in the Tools section.
Where to find me
Message me on Telegram or by email — I respond quickly. Telegram channel and YouTube are for those who want to see real cases before reaching out and understand my approach.