
Marketer, analyst, ex-CMO focused on the Google ecosystem (Ads, Merchant Center, GA4, GTM). Google Partner. 150+ projects, 100+ positive reviews on Freelancehunt, 12+ countries.
- I work directly, with no account managers or subcontractors
- I measure results in sales, not in-platform conversions
- Maximum expertise in the Google ecosystem
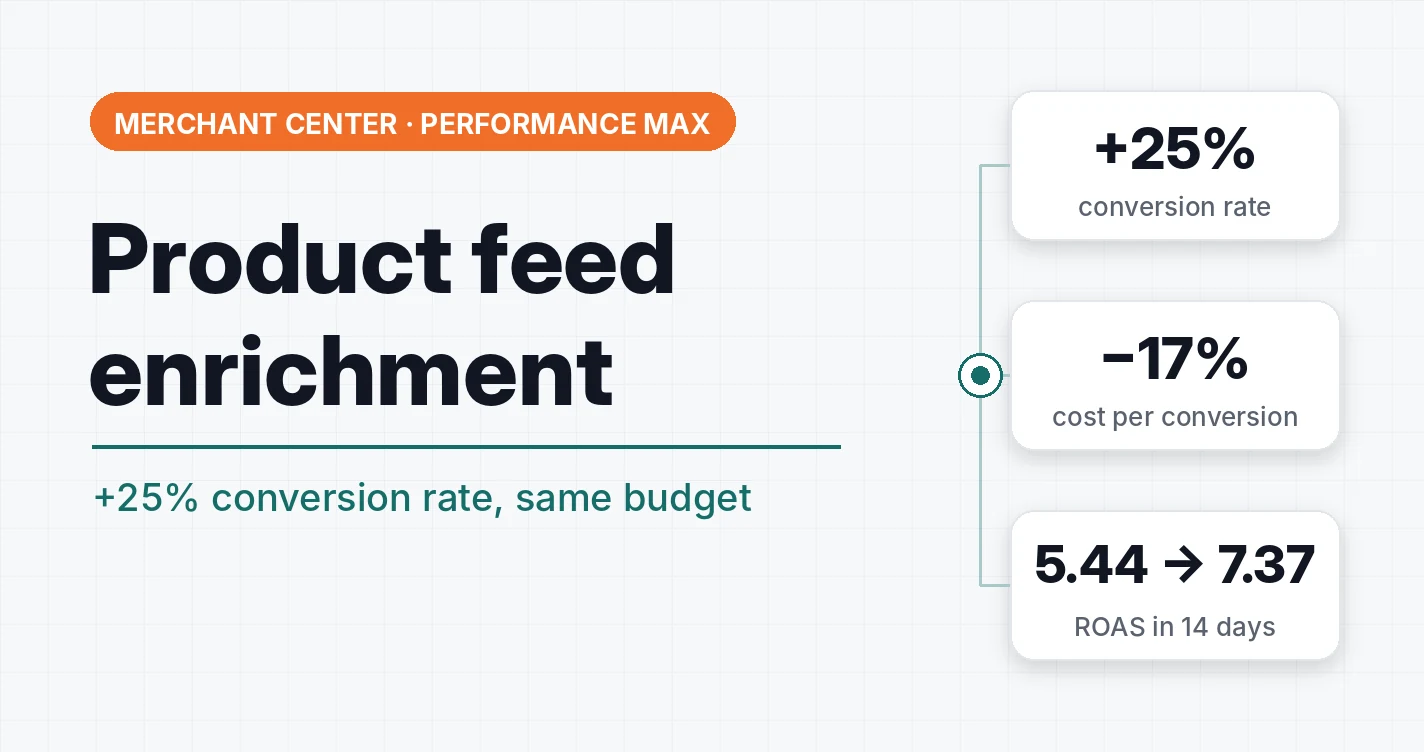
Does a product feed affect Performance Max results if nothing else is touched? I tested it on Optomania, an online garden supplies store: one campaign, the same budget, and a single change — a supplemental feed. In 14 days the conversion rate grew by 25%, cost per conversion fell by 17%, and ROAS was 35% higher. Below I break down exactly what I did, what numbers I got, and why I don’t consider them final yet.
Contents
What it looked like at the start
Optomania sells 4,951 products; over 60% of the range is seeds, crop protection products and fertilizers. Advertising is a single Performance Max campaign with a budget of 500 UAH (~$12) a day, which constantly hits its budget limit.
The feed was generated by the OpenCart website, and Google received only the bare minimum of data:
- google_product_category was missing for every product. Google guessed the category on its own.
- product_detail and product_highlight didn’t exist at all. No structured details: crop, maturity, active ingredient, NPK.
- brand was empty for 1,716 products, 35% of the range.
- description in 32% of products basically duplicated the title, and 433 descriptions mentioned another store’s name.
- title: the pack size (1 g, 0.5 kg, 25 kg bag) was often at the end of the title.
The last point is critical for this store. It sells both retail and wholesale. When the weight is at the end of the title, a person who needs a small packet of seeds clicks on a 25 kg bag, and vice versa. The click is paid for, there’s no purchase.
Hypothesis
If Google gets structured product data and the weight moves to the beginning of the title, Performance Max will match searches and audiences more accurately, and irrelevant people will be filtered out before they click. Expectation: higher conversion rate, lower cost per conversion, higher ROAS.
What I did
I didn’t touch the primary feed or the website. On top of the primary feed in Merchant Center, I connected one supplemental feed in Google Sheets. I explained what a supplemental feed is and how it works in the article about the Merchant Center product feed.
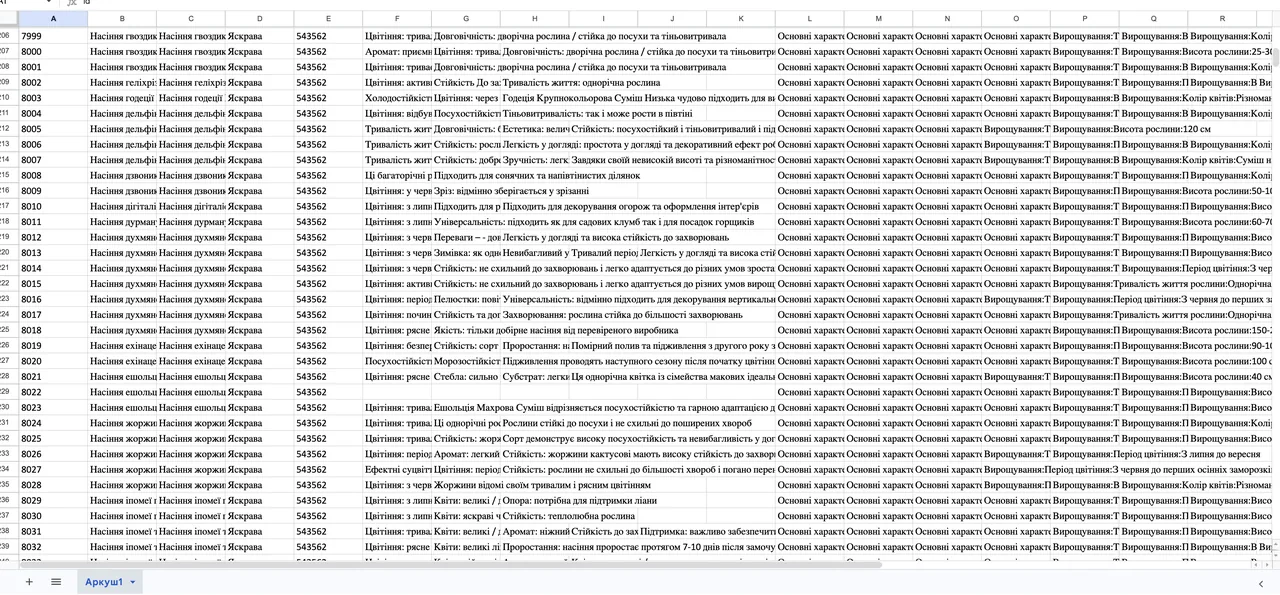
Nobody would fill in 4,951 products by hand. The supplemental feed was generated by a Python script: rules and regular expressions parsed product titles and descriptions and extracted the details from them.
| Attribute | What was done | Products |
|---|---|---|
| google_product_category | Mapping 335 product types to the Google taxonomy, 70 categories | 4 951 / 4 951 |
| product_detail | Seeds: crop, variety or hybrid, maturity, days to harvest, soil, pollination, fruit weight, germination. Crop protection: active ingredient with concentration, mode of action, crops. Fertilizers: NPK, form, series, purpose. Batteries, nets, irrigation: dimensions, density, size type | 4 840 |
| product_highlight | 2–6 highlights per product from descriptions: resistance, purpose, yield, taste, storability | 2 301 |
| title | Weight and pack size right after the product name; for seeds — maturity, pollination, soil; for crop protection — active ingredient; brand where it was missing; fixed Latin letters in Cyrillic words | 3 272 |
| brand | The store’s own brand for products it packs itself | 1 706 |
| description | Fixed store name in descriptions | 433 |
Example title (translated from Ukrainian):
- Before: “Bee-pollinated cucumber seeds Sremsky F1, Poland, Marvel, doypack 0.5 kg”
- After: “Bee-pollinated cucumber seeds Sremsky F1, doypack 0.5 kg, early-maturing greenhouse hybrid, Poland, Marvel”
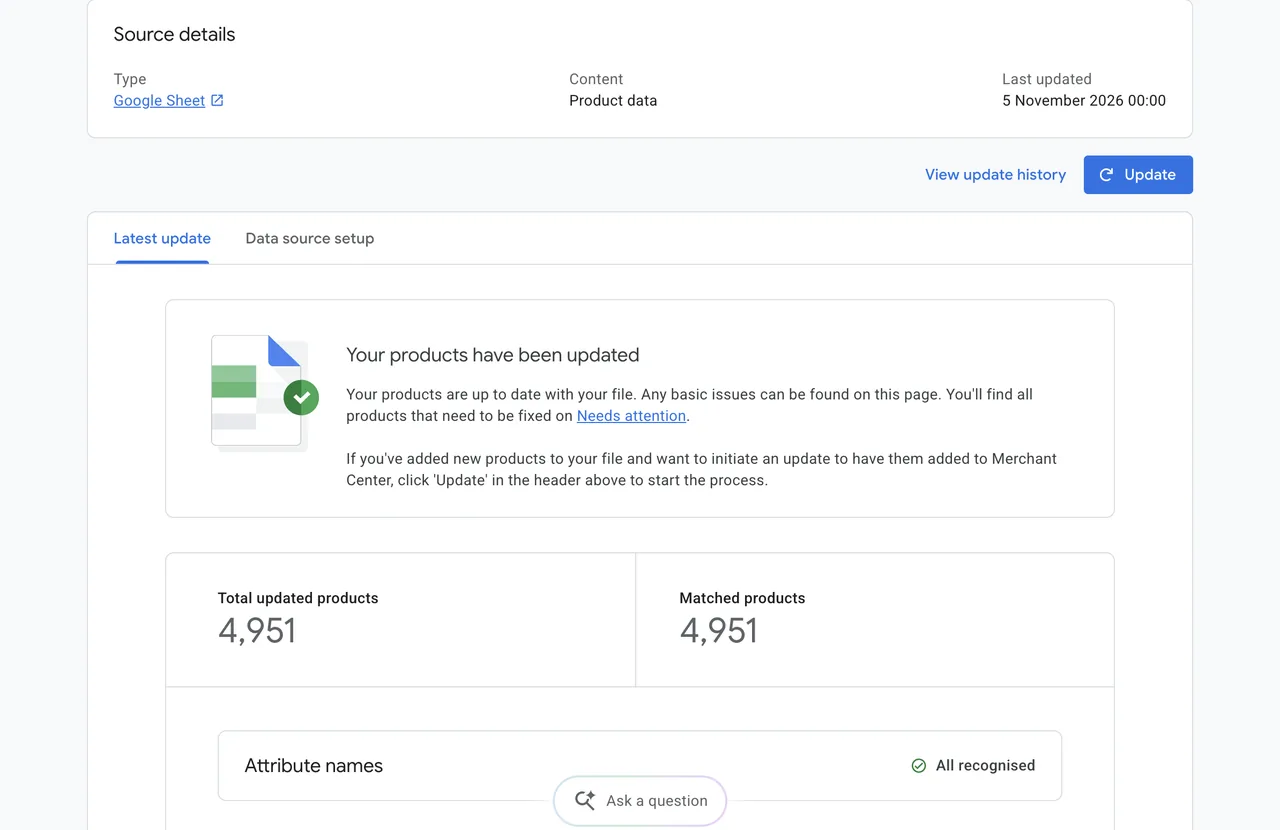
Result in Merchant Center: 4,951 products matched with the primary feed, 0 errors, all attributes recognized.
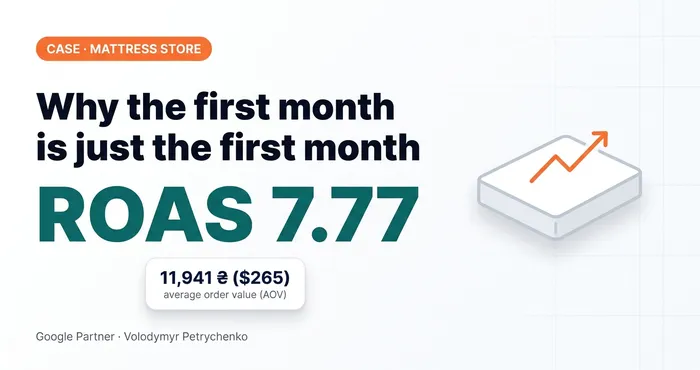 Google Ads case study · Merchant CenterWhy You Shouldn’t Stop After the First Month: A Mattress Store Case StudyMattress store on Horoshop: feed enrichment, shipping_label, CRM instead of fake conversions. Why you shouldn’t stop after the first month.
Test conditions
- Baseline: Oct 8–21, 2026; test: Oct 22 – Nov 4, 2026; 14 days each.
- The same campaign, the same budget of 500 UAH a day, the same conversion action.
- I made no other changes to the campaign. The only change during the period was the supplemental feed.
Results after 14 days
| Metric | Before (Oct 8–21) | After (Oct 22 – Nov 4) | Change |
|---|---|---|---|
| Impressions | 78 475 | 69 715 | −11,2% |
| Clicks | 1 815 | 1 647 | −9,3% |
| CTR | 2,31% | 2,36% | +2,1% |
| Cost per click | 3.99 UAH | 4.15 UAH | +4,1% |
| Spend | 7,236 UAH | 6,839 UAH | −5,5% |
| Conversions | 37 | 42 | +13,5% |
| Conversion rate | 2,04% | 2,55% | +25,1% |
| Cost per conversion | 195.57 UAH | 162.82 UAH | −16,7% |
| Conversion value | 39,368 UAH | 50,411 UAH | +28,1% |
| ROAS | 5,44 | 7,37 | +35,5% |
| Average order value | 1,064 UAH | 1,200 UAH | +12,8% |
What this shows:
- Less traffic, more conversions. Impressions and clicks dropped by 9–11%, while conversions went up. This is consistent with the hypothesis: titles with the weight at the beginning filter out irrelevant people before they click.
- CTR and cost per click barely changed. That’s expected. Filtering the audience through titles doesn’t necessarily raise CTR. Besides, a budget-limited Performance Max spends its whole budget.
- Part of the ROAS growth comes from a higher average order value. It grew by 13%, and a direct link between that and the feed hasn’t been proven.
Key takeaway: the feed is the only thing Performance Max knows about your product. The more accurate details it contains, the more precisely the system chooses who to show the product to.
Why I don’t consider these numbers final yet
37 vs 42 conversions is a small sample. The difference in conversion rate has p ≈ 0.3, so it isn’t statistically significant yet. In theory, chance alone could produce a difference like this.
At the same time, the test conditions are as clean as they get: one campaign, unchanged budget and settings, the only change is the supplemental feed. And seasonality most likely works against the result: demand for garden products falls in autumn. So the real effect may be even bigger. I haven’t compared it with the same period last year yet.
The test has been extended to 4 weeks, until Nov 18, 2026. When the final data is in, I’ll update the article.
I explained in detail why I’m so careful with conclusions over short periods in the “Stuffy Numbers” series.
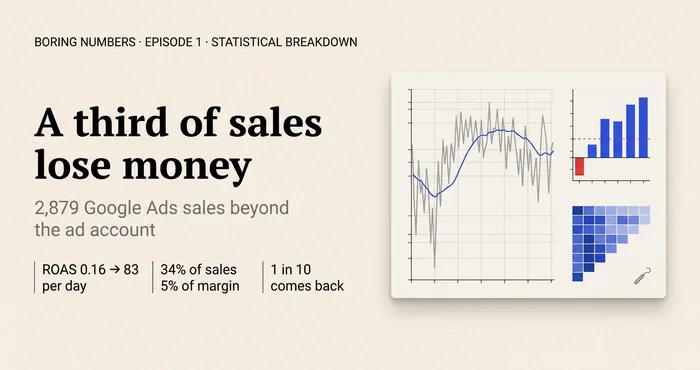 Analytics · Google AdsGoogle Ads Analytics Beyond the Ad Account: A Statistical Breakdown of 2,879 Dental Equipment SalesA statistical breakdown of 7 months of Google Ads for a dental equipment store: ROAS noise, big deals, loss-making cheap baskets, calls and LTV.
Check your own feed
Open any product in Merchant Center and see which attributes are filled in. If there’s only the title, description, price and image, while google_product_category, product_detail and brand are empty, Google knows less about your product than a shopper who opened the product page on your site. And look at the titles: does the beginning show what people search for and choose your products by?
20 — Merchant CenterProduct feed setup and optimizationFeed setup, optimization and enrichment with extra attributes, product segmentation with custom labels.
Where to find me
Message me on Telegram or by email — I respond quickly. Telegram channel and YouTube are for those who want to see real cases before reaching out and understand my approach.