
Marketer, analyst, ex-CMO focused on the Google ecosystem (Ads, Merchant Center, GA4, GTM). Google Partner. 150+ projects, 100+ positive reviews on Freelancehunt, 12+ countries.
- I work directly, with no account managers or subcontractors
- I measure results in sales, not in-platform conversions
- Maximum expertise in the Google ecosystem
Looker Studio (formerly Google Data Studio) is Google’s free tool for dashboards and reports. I’ve been building dashboards in it for clients for several years: Google Ads spend, CRM orders and sometimes Google Analytics data in one report.
In parallel, I develop my own custom dashboards for the same tasks. I do both, but I recommend the custom one to clients. Below, using two real projects, I show what the same report looks like in Looker Studio and in a custom dashboard, and why I came to that conclusion.
Contents
- What Looker Studio is
- Why you need a dashboard for Google Ads at all
- Example 1: an online store dashboard in Looker Studio
- Example 2: B2B and B2C, margin and ROMI in Looker Studio
- Where Looker Studio starts to glitch
- Custom dashboards: the same data, no glitches
- Looker Studio or a custom dashboard
- Where to start
- FAQ
What Looker Studio is
Looker Studio is an online report builder. You connect data sources, drag charts, tables, scorecards and filters onto a page, and get a dashboard anyone can open via a link. In October 2022 Google renamed Data Studio to Looker Studio, which is why both names still show up in search.
What’s good about it:
- Free. The basic version costs nothing; the paid Looker Studio Pro is mostly for large teams.
- Native Google connectors. Google Ads, GA4, Search Console, Google Sheets and BigQuery connect in a few clicks.
- Sharing. A dashboard opens via a link, and permissions work like in Google Docs.
- Familiar interface. Many marketers and business owners have already seen Looker Studio and know how to use it.
For a simple report from one source, say “Google Ads spend and conversions by day”, that’s quite enough.
Why you need a dashboard for Google Ads at all
Google Ads shows conversions, not money. It doesn’t know which order was canceled, which wasn’t picked up at the post office, which was paid and at what margin. ROAS in the account can look great while the business makes no money.
That’s why my dashboards almost always combine several sources:
- Google Ads: spend, clicks, campaigns;
- CRM: real orders with UTM tags, statuses, value and margin;
- Google Analytics: sometimes, when you need on-site behavior or sources that aren’t in the CRM.
The main requirement: the CRM must receive the UTM tags and gclid of every order. Without that, a dashboard can’t tell which sales came from ads. What this looks like in a real project where the CRM integration had to be fixed, see the KeepinCRM case study.
 Analytics + Google AdsEnd-to-end analytics: what problems it really solvesWhat end-to-end analytics really is, why a business needs it and what real dashboards look like for lead generation, B2B and mixed e-commerce.
Example 1: an online store dashboard in Looker Studio
An online store, google / cpc traffic only. The Looker Studio dashboard has a date range, an order status filter, six scorecards, a chart of order value and spend by day, and a campaign table.
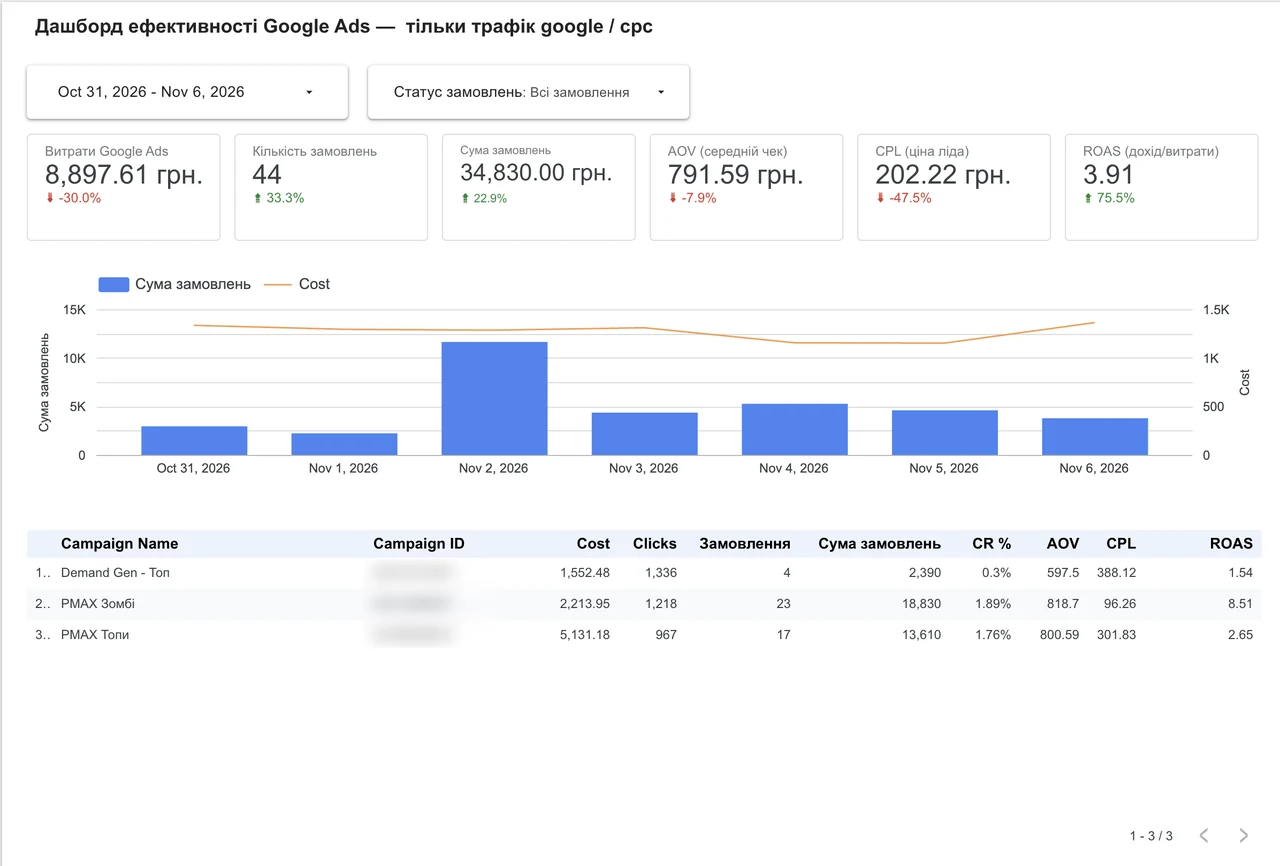
For the week of Oct 31 – Nov 6, 2026: 8,897.61 UAH ($198) in spend, 44 orders worth 34,830 UAH ($774), an average order value of 791.59 UAH ($17.6), ROAS 3.91. The campaign table shows that three campaigns differ a lot in profitability: ROAS 8.51, 2.65 and 1.54. You don’t see this picture in Google Ads, because there conversions are counted from site data, while here they’re real orders from the CRM.
Look at the scorecards with changes: cost per lead dropped by 47.5%, and Looker Studio highlighted it in red. For cost per lead, a drop is good. You have to set the color in each scorecard manually, and Looker Studio has lots of small things like that.
Example 2: B2B and B2C, margin and ROMI in Looker Studio
The second project is more complex: orders come from both retail customers and businesses. Here the dashboard also shows gross margin and ROMI, and there are more filters: order status, traffic source and customer type.
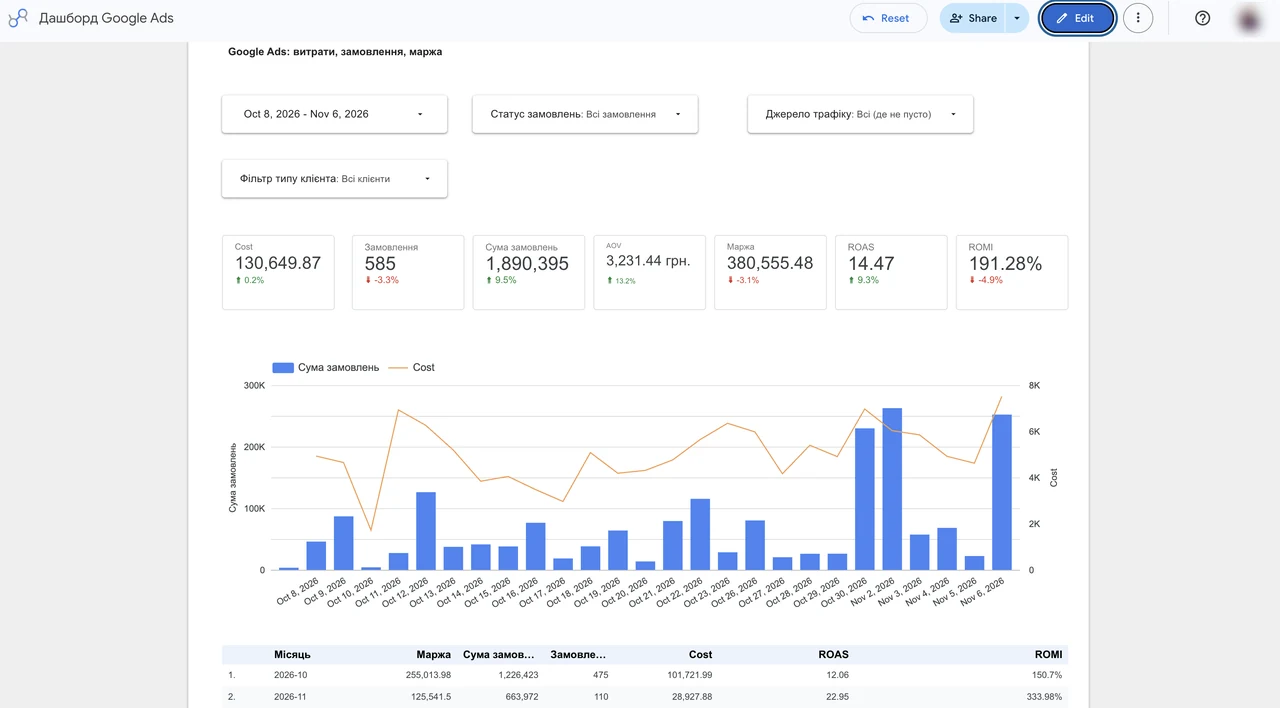
Over 30 days (Oct 8 – Nov 6, 2026): 130,649.87 UAH ($2,903) in spend, 585 orders worth 1,890,395 UAH ($42K), gross margin of 380,555.48 UAH ($8,457), ROAS 14.47, ROMI 191.28%.
Why you need to look at ROMI and not just ROAS: a ROAS of 14 with a low margin can mean less profit than a ROAS of 5 with a high one. More on the difference in the article high ROAS but no money.
Where Looker Studio starts to glitch
While a report is simple, Looker Studio works fine. Once it has CRM data, several sources, calculated fields and filters, in my experience it works every other time.
- Loading errors. Charts periodically show an error instead of data, especially with the GA4 connector, where Google limits the number of API requests. The client opens the report in the morning and half the scorecards are empty.
- Slow performance. A dashboard with several sources and blended data loads slowly, and every filter change means waiting again.
- Blending limits. One blend allows up to 5 sources, and complex logic like “CRM orders + Google Ads spend + a B2B/B2C split” turns into a chain of workarounds.
- Update delays. Data from Google Sheets and external sources is cached, so after a CRM update the report shows old numbers for a while.
- Breaks when the source changes. Rename a column in a sheet or change the date format, and some charts stop working, so you have to fix the fields by hand.
- No forecast. Looker Studio can’t forecast the month from current trends out of the box.
For me it’s a matter of trust in the numbers. If a client opened the report twice and saw an error, they won’t open it a third time. And a report nobody opens is worth nothing.
Custom dashboards: the same data, no glitches
So I started building my own dashboards. The data is the same: Google Ads, CRM and GA4 if needed. But I design the interface, calculation logic and filters for the specific business, and it works reliably.
The same store
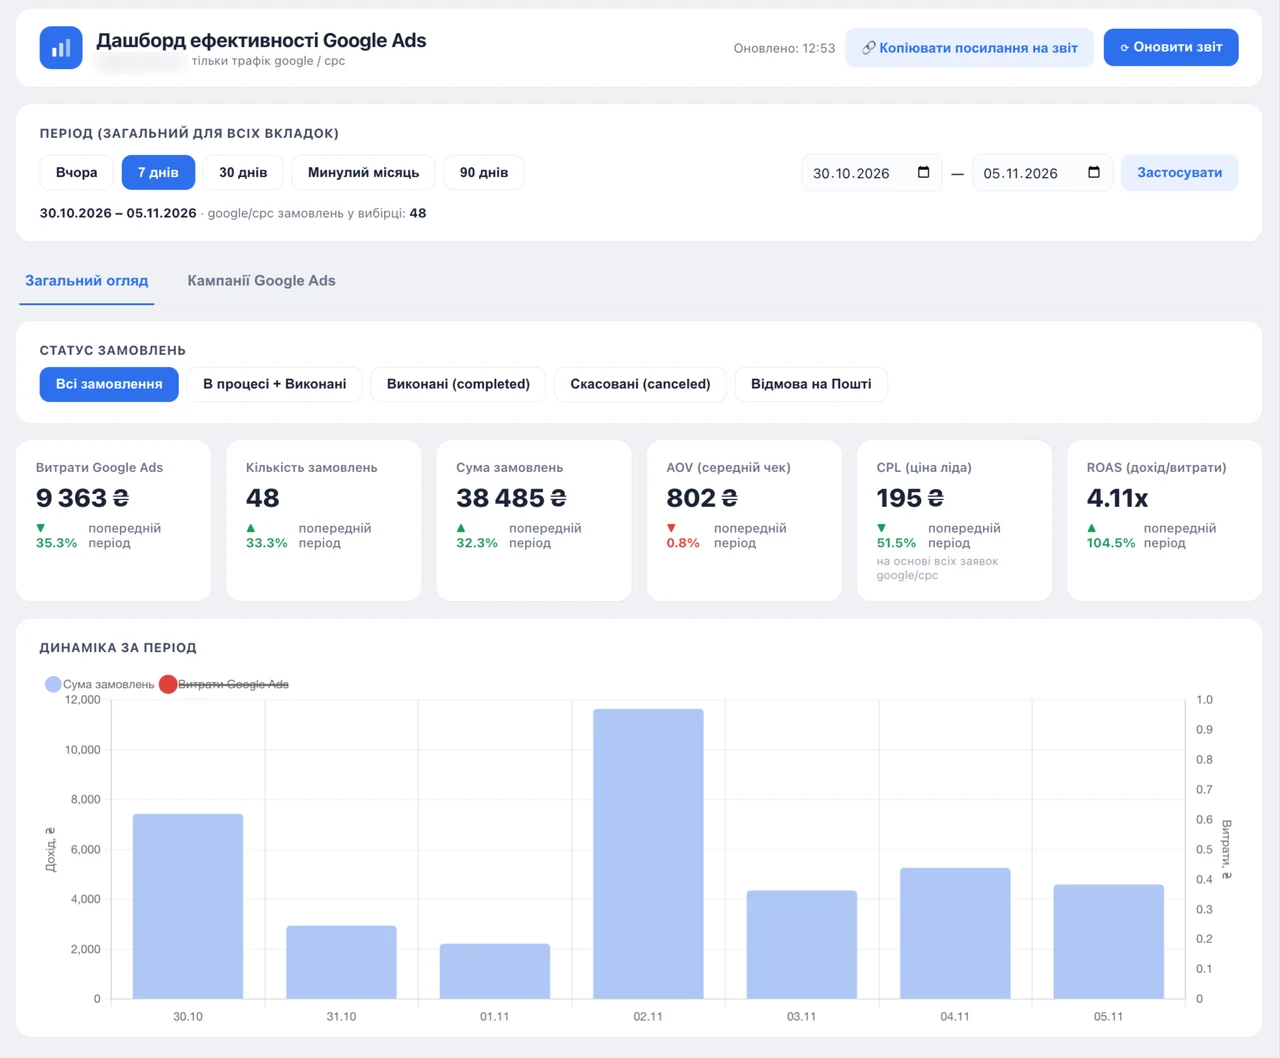
What’s here that the Looker Studio version doesn’t have:
- Quick date range buttons: yesterday, 7 days, 30 days, last month, 90 days, plus custom dates. One range applies to all tabs.
- Comparison with the previous period in every scorecard, colored by meaning: lower spend and cost per lead are green, a lower average order value is red.
- Order statuses tailored to this business: all, in progress + completed, completed, canceled, refused at the post office.
- A separate Google Ads campaigns tab.
- “Refresh report” and “Copy link” buttons with the last update time, so the client can see how fresh the numbers are.
The same B2B/B2C project
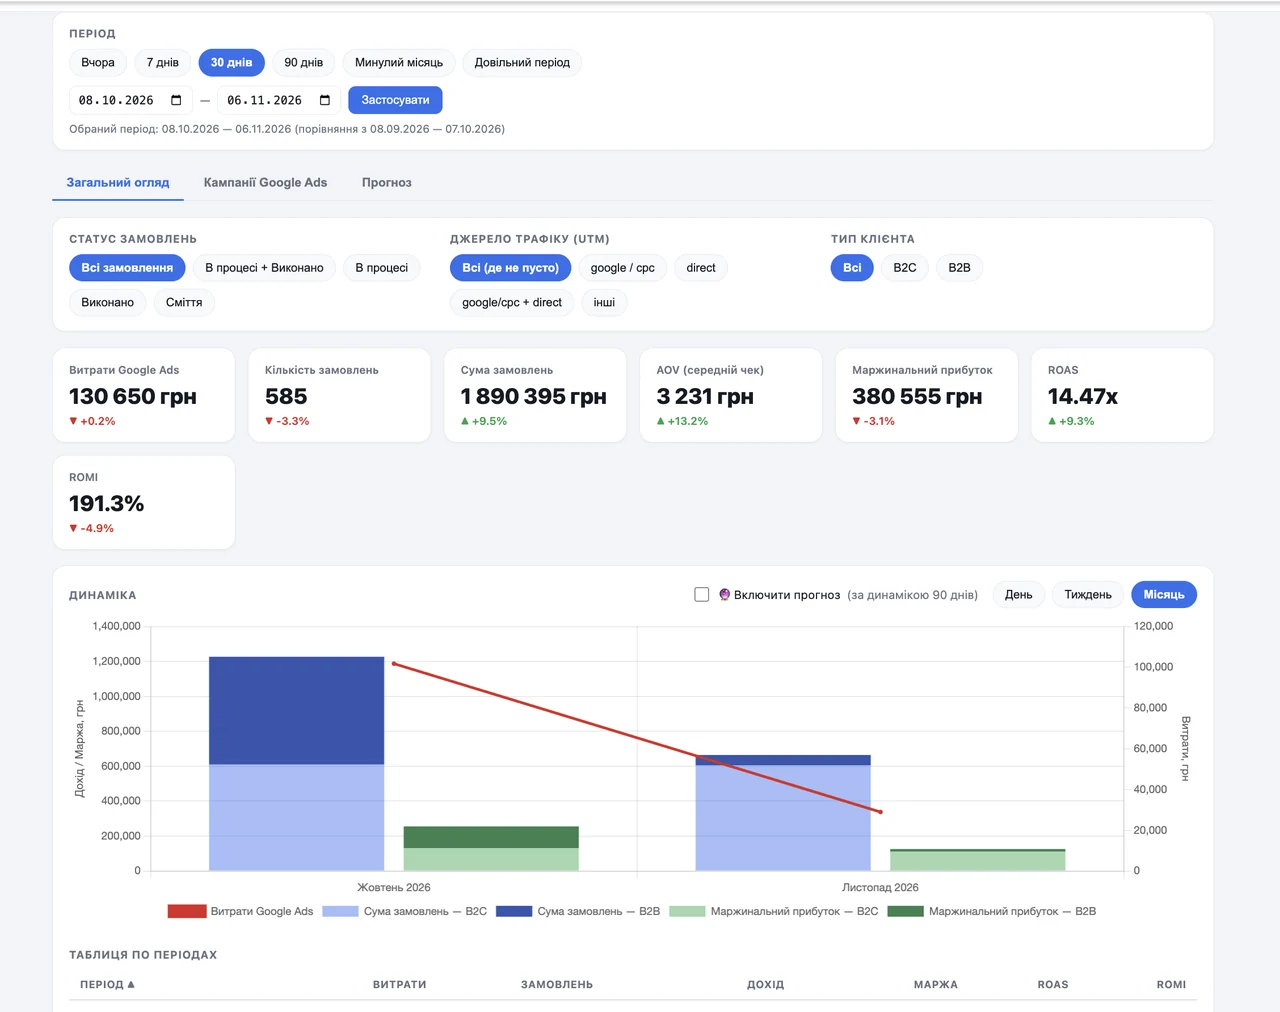
The numbers match Looker Studio down to the hryvnia: 130,650 UAH ($2,903) in spend, 585 orders, 1,890,395 UAH ($42K), margin of 380,555 UAH ($8,457), ROAS 14.47, ROMI 191.3%. The difference is what you can do with them:
- A “Junk” filter among order statuses: you can see separately how many orders never had a chance of becoming a sale.
- Traffic source by UTM: google / cpc, direct, google / cpc + direct, other.
- B2B / B2C customer type in one click, and the chart splits order value and margin into B2B and B2C.
- Grouping by day, week or month.
- Forecast based on the last 90 days: a separate tab and a toggle right on the chart.
Looker Studio or a custom dashboard
| Looker Studio | Custom dashboard | |
|---|---|---|
| Tool cost | free | built for the project |
| Stability with several sources | glitches | stable |
| Speed | slow on complex reports | fast |
| Business logic (statuses, B2B/B2C, margin) | through workarounds | built into the calculations |
| Forecast | no | yes |
| Client can edit it themselves | yes, in the editor | through me |
I build both. Looker Studio works when the report is simple, there’s one source and the client wants to change things themselves. When the dashboard needs CRM data, margin, order statuses and daily work with numbers, I recommend a custom one.
How to set up Google Ads reporting in general, from simple tables to CRM and dashboards, see the article what Google Ads reporting should look like.
25 — AnalyticsLooker Studio dashboardsGoogle Ads, GA4 and other sources in one report. Built for any need, from sales to margin.Where to start
Before ordering any dashboard, place a test order on your site with an ad tag, for example by adding ?utm_source=google&utm_medium=cpc&gclid=test to the URL, and check the order card in your CRM. If the source and gclid show up there, the data for a dashboard is already in place. If not, start with integrating the site with the CRM, because without it no dashboard will show which sales came from ads.
Where to find me
Message me on Telegram or by email — I respond quickly. Telegram channel and YouTube are for those who want to see real cases before reaching out and understand my approach.