
Marketer, analyst, ex-CMO focused on the Google ecosystem (Ads, Merchant Center, GA4, GTM). Google Partner. 150+ projects, 100+ positive reviews on Freelancehunt, 12+ countries.
- I work directly, with no account managers or subcontractors
- I measure results in sales, not in-platform conversions
- Maximum expertise in the Google ecosystem
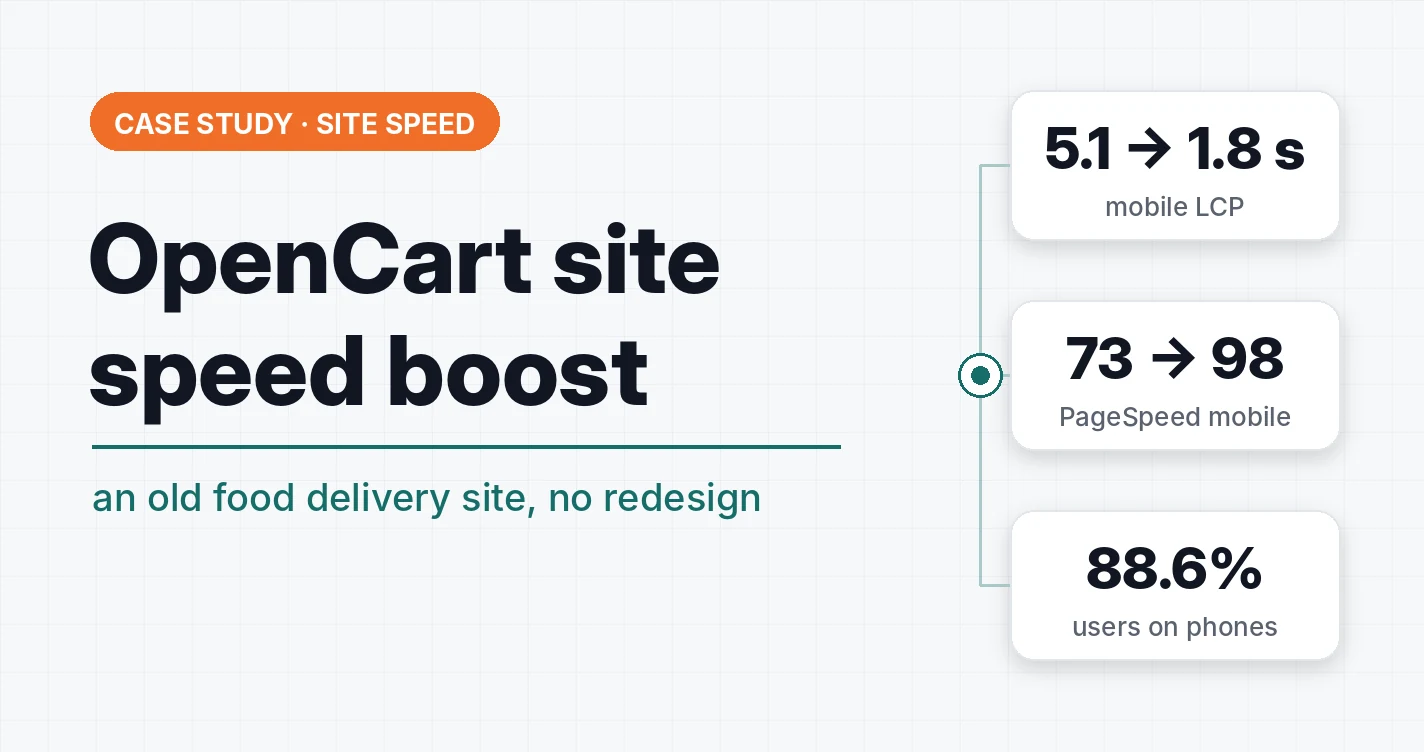
An old food delivery website on OpenCart, built more than 8 years ago. Its mobile version sat in Google’s “red” speed zone. After two rounds of fixes, the median LCP of the homepage dropped from 5.1 to 1.8 s, and the PageSpeed score went from 73 to 98. The design, content and admin panel stayed exactly the same.
Contents
| Metric (mobile, median of 10 runs) | Before | After |
|---|---|---|
| Homepage LCP | 5.1 s | 1.8 s |
| “Pizza” category LCP | 3.0 s | 2.0 s |
| Homepage PageSpeed | 73 | 98 |
| “Pizza” category PageSpeed | 83 | 93 |
| Homepage PageSpeed, desktop | — | 100 |
Why the mobile version is almost the whole site
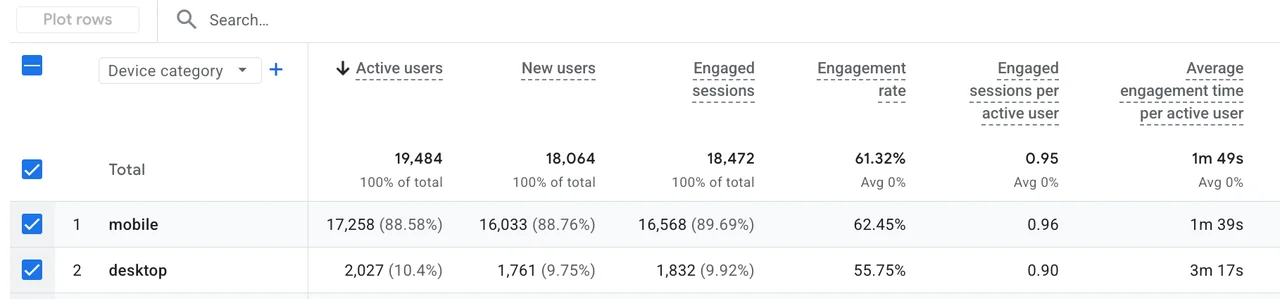
According to GA4, 88.6% of active users (17,258 of 19,484) and 89.7% of engaged sessions come from phones. Desktop accounts for only 10.4% of users. For food delivery that makes sense: people order from the couch or on their way home.
A hungry person on a phone won’t wait 5 seconds for the menu to show up. They’ll go to a competitor. On top of that, Google factors Core Web Vitals into rankings: three metrics of real Chrome users’ experience:
- LCP: how fast the main element of the page appears, good is under 2.5 s;
- CLS: whether the page “jumps” while loading, good is under 0.1;
- INP: how fast the site responds to actions, good is under 200 ms.
The goal: get the mobile version into the “green” Core Web Vitals zone without breaking anything in orders or analytics.
Starting point
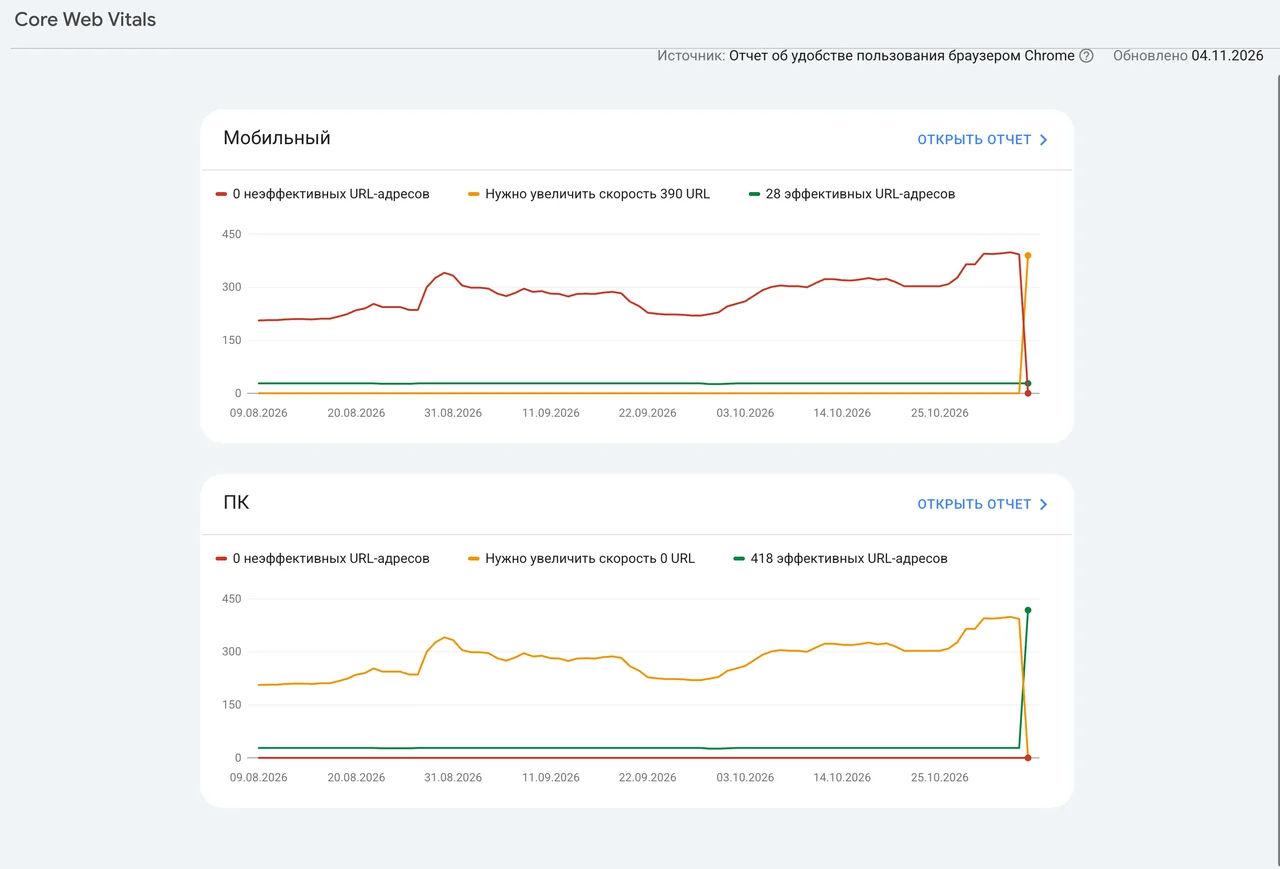
At the start, the mobile version was in the “red” zone: about 390 URLs in the Core Web Vitals report in Search Console. Desktop was in the “yellow” zone.
I did the first round of fixes as part of the site’s SEO work: image dimensions, WebP, removing an extra jQuery. The report from November 4, 2026 showed:
| Device | Poor | Need improvement | Good |
|---|---|---|---|
| Mobile | 0 | 390 | 28 |
| Desktop | 0 | 0 | 418 |
Desktop moved into the “green” zone, mobile went from “red” to “yellow”. Two problems remained: CLS above 0.1 and LCP above 2.5 s.

 SEO · Food deliveryFood delivery website SEO: what I did and why, a breakdown of a real reportA pizza delivery site on OpenCart: 15 categories, 53 articles, 29 pages for districts and villages, Ahrefs 20 → 100, clean sitemaps, structured data, CLS 0.383 → 0 and the cause of a 6-second checkout.
Real users (CrUX)
Chrome field data: p75 of real mobile users over 28 days, pulled on November 7, 2026 via the PageSpeed Insights API. This period falls almost entirely before the fixes.
| Metric (p75) | UA homepage | RU homepage | “Pizza” UA | Whole site |
|---|---|---|---|---|
| Google rating | slow | slow | fast | fast |
| LCP, s | 3,21 | 3,25 | 0,95 | 1,13 |
| CLS | 0,39 | 0,39 | 0,01 | 0 |
| INP, ms | 152 | 161 | 163 | 154 |
| FCP, s | 1,66 | 1,64 | 0,85 | 0,89 |
| TTFB, s | 1,02 | 1,14 | 0,50 | 0,49 |
The weakest page is the homepage. An interesting detail: in lab tests the homepage CLS is 0.022, while in real data it is 0.39. CrUX counts layout shifts over the whole visit: scrolling, pop-ups, blocks loading in later. A lab test only sees the moment of loading.
What was slowing it down
I went through the mobile PageSpeed Insights reports for the homepage and the “Pizza” category. Images were only part of the problem. Most of the slowdown came from things that loaded together with the page and blocked it from showing.
| Factor | Size | Impact |
|---|---|---|
| Google Tag Manager + GA4 | 350 KB | 377 ms of browser work during loading |
| Facebook Pixel | 225 KB | 218 ms |
| Microsoft Clarity | 28 KB | 75 ms |
| Old jQuery 2.1.1 in the header (duplicate) | 87 KB | ~0.9 s of white screen |
| main.css in the header | 232 KB | ~0.45 s of white screen |
| Dish photos in JPG/PNG | ~1.1 MB per category | heavy main photo on the first screen |
| Mobile slides 990×1024 | 58 KB per slide | larger than needed for a ~720 px screen |
| Images without dimensions | — | the page “jumped” (CLS) |
One more thing: PageSpeed results swing a lot from run to run. LCP of the same page ranged from 1.5 to 11 s. So I made decisions based on the median of 10 runs.
What I did
Stage 1: stable layout and lighter photos
- Image dimensions. I added width and height to dish cards, article previews, the logo and icons. The browser reserves the space in advance, so content doesn’t shift.
- Dish photos in WebP. The site now creates and serves WebP copies itself, the originals stay untouched. A test on 10 photos showed a 73% weight reduction, and the “Pizza” category now weighs 537 KB instead of 1,089 KB. Older browsers still get JPG.
- Removed the duplicate jQuery. The old 2.1.1 version in the header only delayed the page from showing. The one script that depended on it, the pizza crust picker, I moved to the main 3.3.1 version.
Stage 2: a fast first screen
- Inline styles for the first screen. I inlined ~49 KB of styles needed for the first screen right into the page. The full main.css (232 KB) loads after the page is shown.
- Priority for the first photos. The browser loads the first 2 photos in each category ahead of other files. The main photo on the first screen starts loading ~190 ms earlier.
- Lighter mobile slides. Regular phones get a 750 px slide: 38 KB instead of 58 KB. High-density screens and tablets still get 990 px, as before.
- Delayed Google Tag Manager start. GTM now starts after the page is shown or on the visitor’s first action: scroll, touch, click. The gtm.js event is pushed right away, so the event order in the dataLayer is the same as before and ecommerce events aren’t lost. Facebook Pixel was already on a “Window Loaded” trigger, and Clarity is turned off.
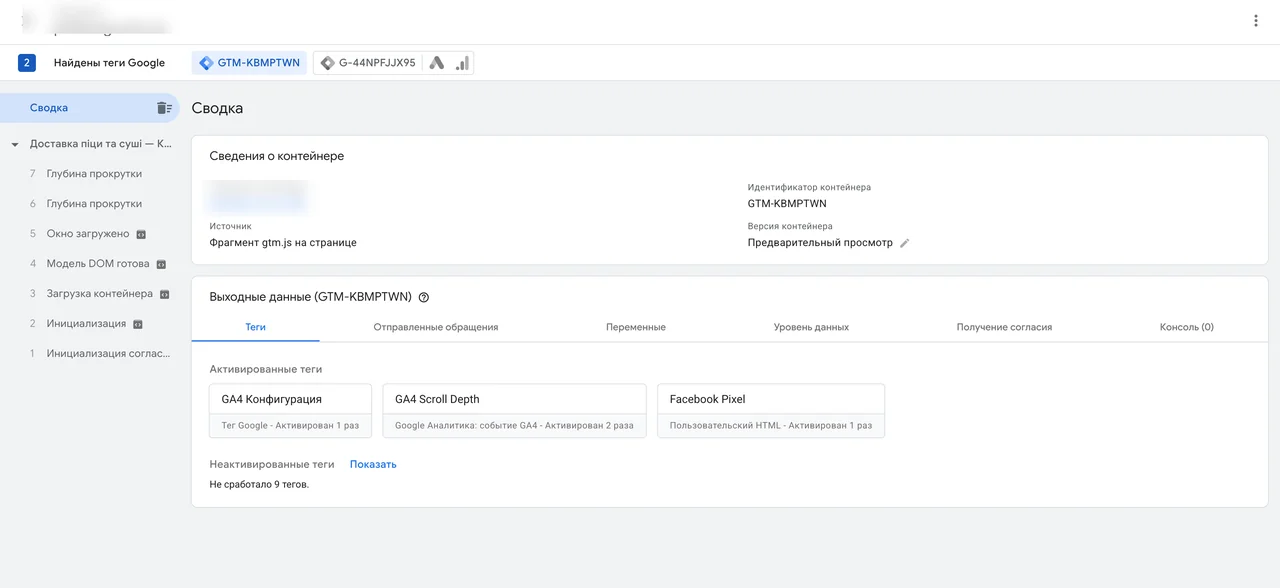
Delaying GTM was a conscious decision: visits shorter than ~1 second no longer get into the stats. Those visits have no value for analytics or ads.
How I worked so nothing broke
The site takes orders every day, so no change reached visitors until it had been checked in test mode and measured.
- Diagnostics first. Before any changes, a check that changes nothing on the site: whether the server supports WebP, how much the files weigh, how the slider is built.
- Every change with a rollback. Each fix could be previewed first, then applied with a backup of the files and rolled back in one click. Before deploying, the code was tested on a copy of the site.
- Test mode. New behavior first worked only for pages with a separate test parameter. Regular visitors didn’t notice anything.
- Feature checks. Homepage, categories, reviews, cart, RU version, crust picker and price recalculation, a test order, tags in GTM preview. For the inline styles, an automatic comparison of first-screen element positions with and without the full main.css.
- 10 runs per test. A single PageSpeed run proves nothing. I built a tool that runs the PageSpeed Insights API from a server. Each variant got 10 mobile runs without PageSpeed caching, then the median.
- Rollout to everyone. Only after that was a fix turned on for all visitors, and I checked everything again.
Results
After stage 2, mobile LCP of both key pages dropped below the 2.5 s threshold: the homepage from 5.1 to 1.8 s, the “Pizza” category from 3.0 to 2.0 s.
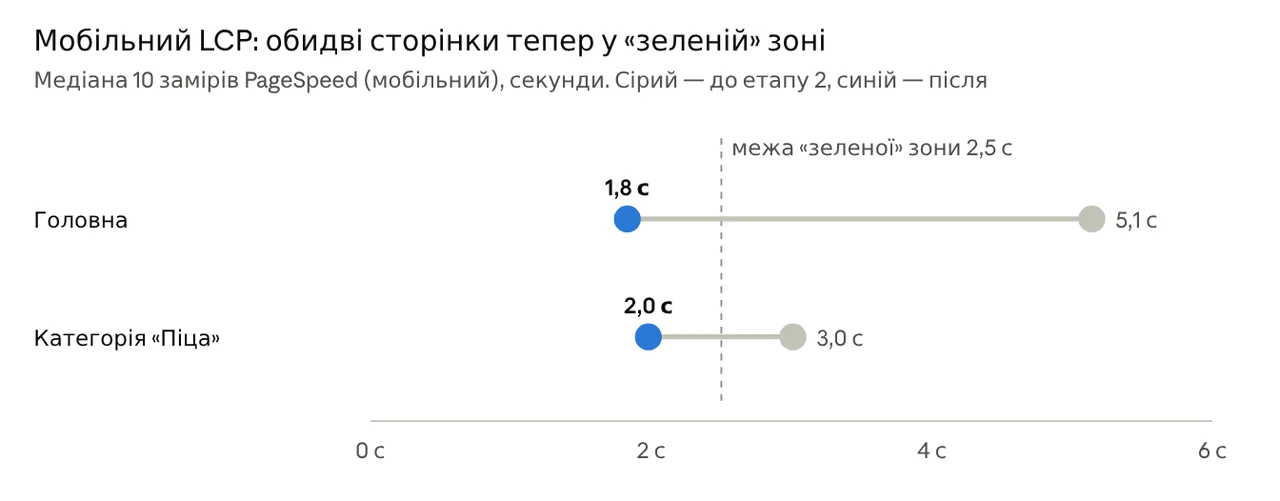
| Metric (mobile, median of 10 runs) | Homepage, before | Homepage, after | “Pizza”, before | “Pizza”, after |
|---|---|---|---|---|
| PageSpeed score | 73 | 98 | 83 | 93 |
| TBT, ms | 255 | 136 | 381 | 264 |
| Speed Index, s | 2,1 | 1,5 | 2,0 | 1,8 |
| FCP, s | 0,93 | 0,93 | 0,94 | 0,94 |
| CLS | 0,022 | 0,022 | 0,012 | 0,024 |
“Before” here is the state after stage 1, “after” is after stage 2.
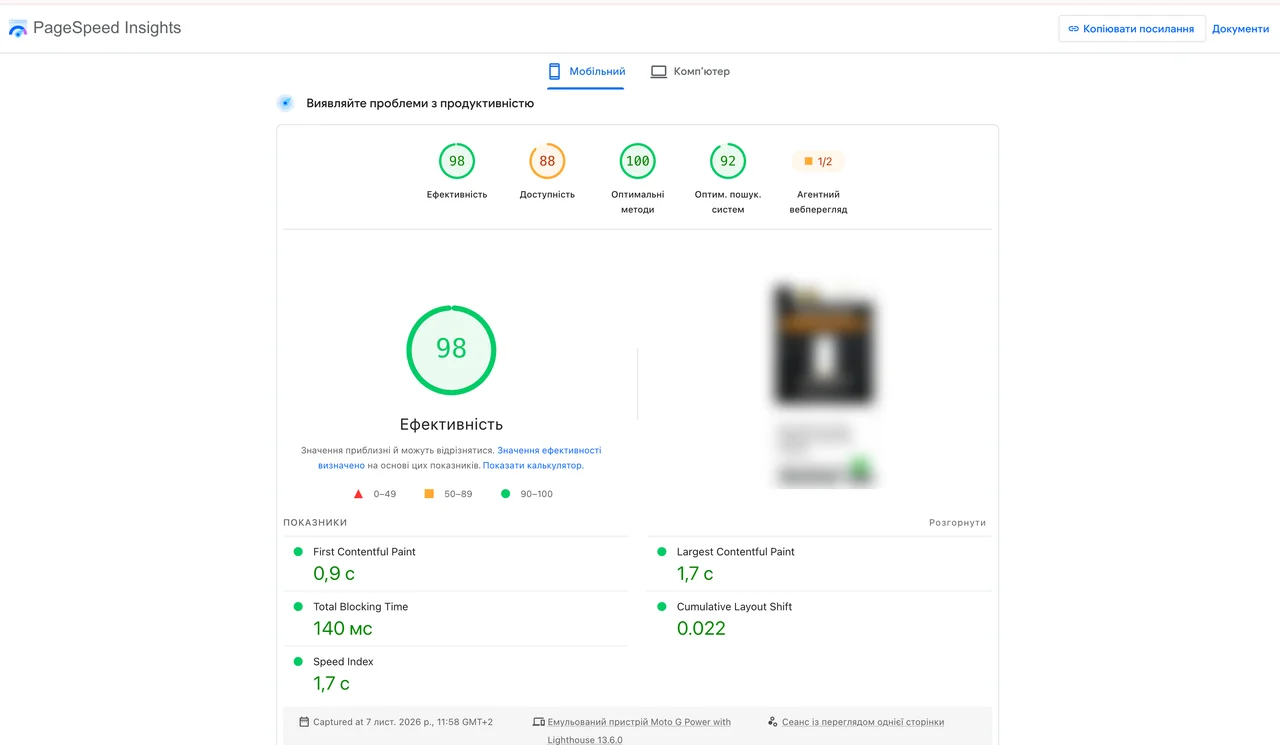
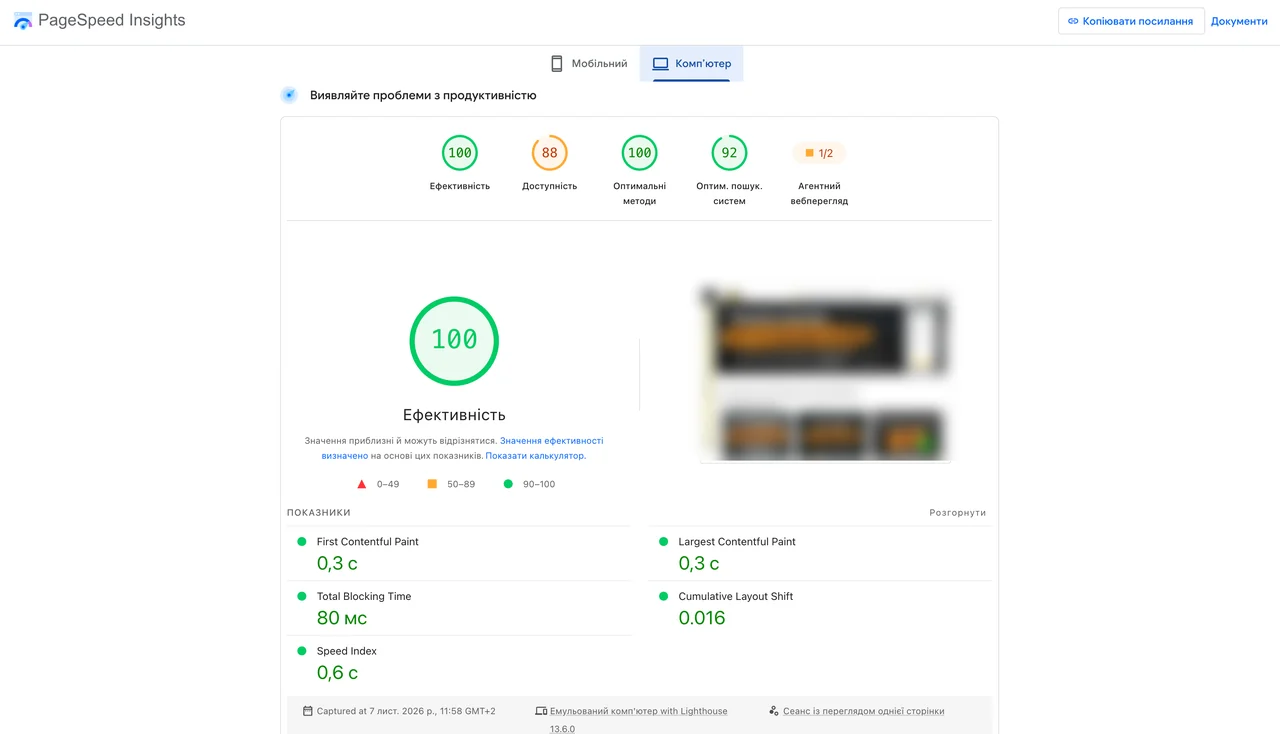
A control run of the homepage in PageSpeed Insights after the rollout: mobile scored 98 (LCP 1.7 s, TBT 140 ms, CLS 0.022), desktop scored 100 (LCP 0.3 s).
A repeat check of Google’s real-user data is planned for the twenties of November, when the new version of the site will dominate the 28-day window, and for early December, when the window fully switches over. I’ll update the case then.
Key point: the speed of an old site rarely comes down to images alone. The biggest gains here came from delayed third-party scripts and first-screen styles inlined into the page.
Bonus: the iPhone menu needed two taps
In the mobile menu on iPhone, you had to tap a category twice. The first tap on “Pizza” or “Sushi” did nothing, and navigation only worked on the second one. The bug didn’t reproduce on desktop or in phone emulation.
Diagnostics on a real phone. I added a hidden panel to the site that turned on only with a separate parameter, logged all touch events and kept them across pages. One screenshot from an iPhone showed the cause.
The cause. If a finger landed on a category’s SVG icon, Safari sent touchend and mouseover, but not click. It’s a known iOS quirk with SVG inside links. On top of that, the old code expanded the desktop menu on “hover” even on phones.
The fix. One CSS rule: SVG icons in links don’t capture taps (pointer-events: none), so the tap reaches the link itself. Expanding the menu on hover now works only on computers with a mouse.
The result. On an iPhone with iOS 18.7, categories open on the first tap, whether you hit the text or the icon.
Phone bugs are found on phones: in emulation this problem simply wasn’t visible.
 Google Ads · MarketingCRO for Google Ads: it’s not the ads wasting your budget. Your website isWhy ads can’t carry a broken website: two real CRO reviews (a medical sensor landing page and a product page) and a first-screen checklist.
Where to find me
Message me on Telegram or by email — I respond quickly. Telegram channel and YouTube are for those who want to see real cases before reaching out and understand my approach.